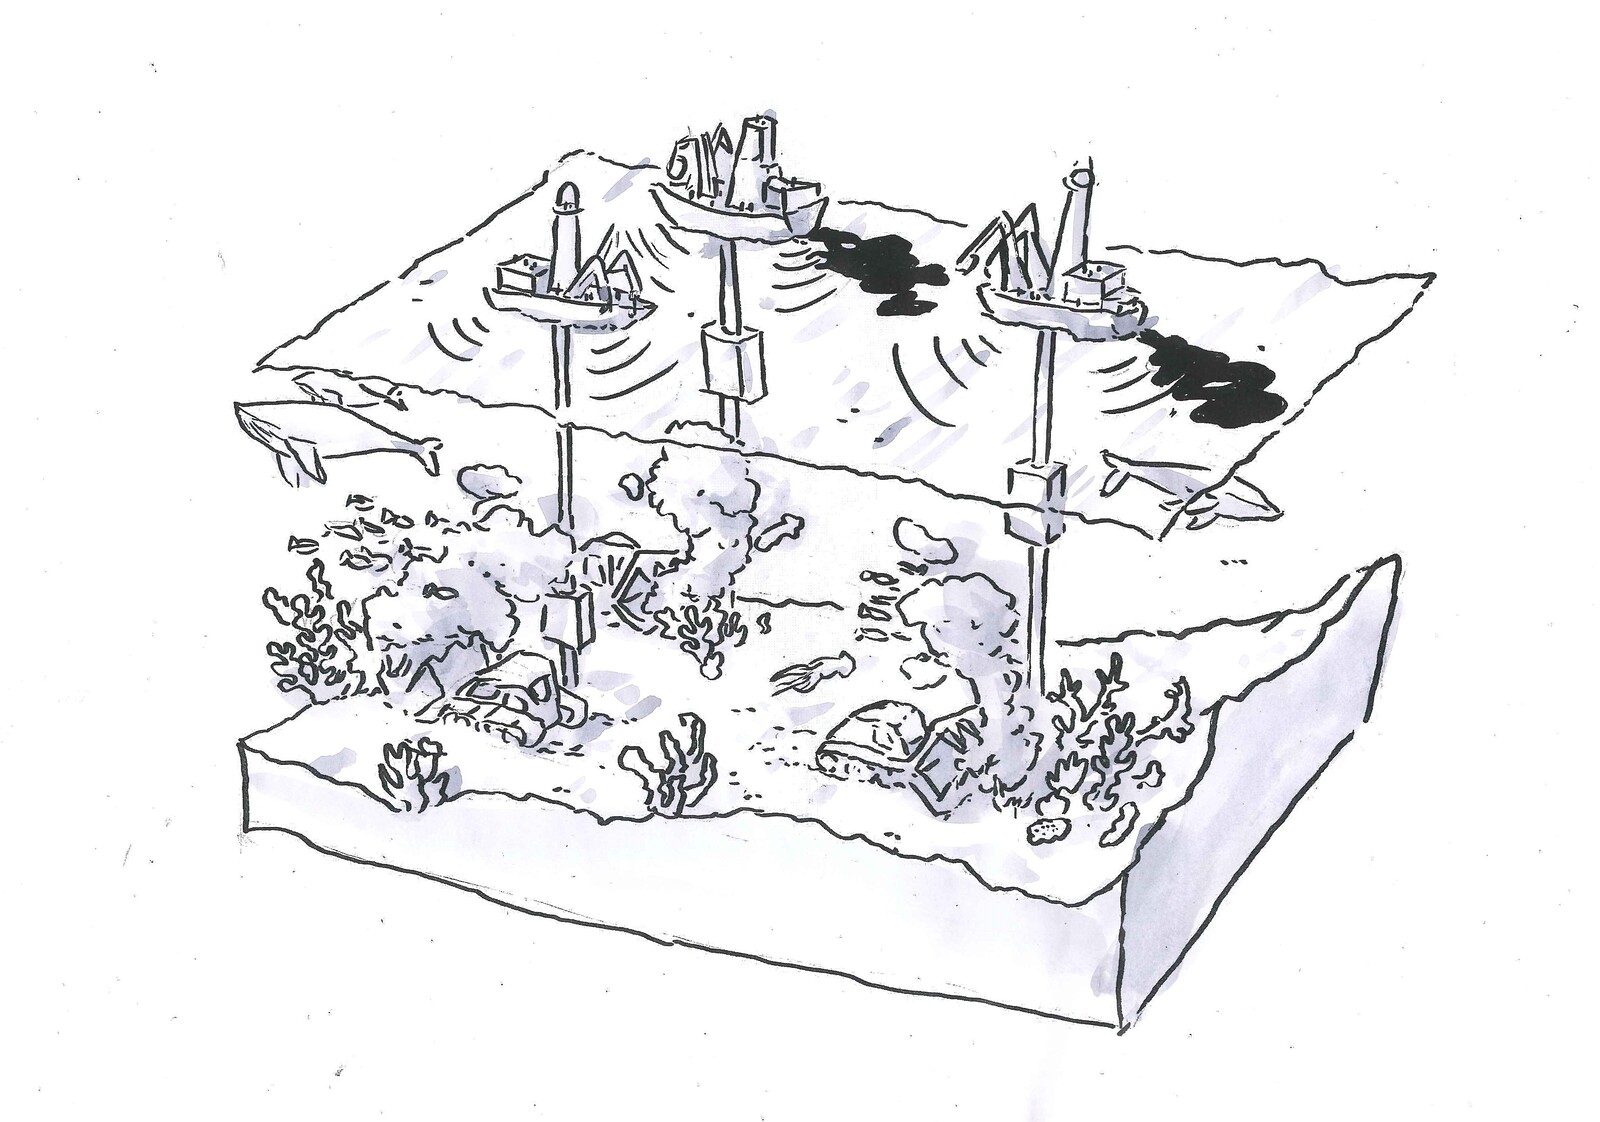
Flying above oceanic anchorages near the world’s largest oil ports reveals a tangle of all sorts of cargo ships waiting to bunker (refuel), as well as load or unload petroleum or chemicals. Oil ports often—though not always—also boast proximity to both vast land-based tank farms for the storage of oil, natural gas, and petrochemicals, as well as to refineries. These oil facilities are usually visible in their totality only from the air or from the sea, with loading buoys sometimes a mile or more away from the shore itself, and the ships anchoring still further. Tank farms tend to be hidden behind layers of barbed wire fencing and security, and strips of wasteland often separate them from the roads that run alongside. These interconnected coastal infrastructures reveal the extent to which the extraction, storage, pricing, and sale of petroleum and petrochemical products is not just dependent on the maritime circulation of petroleum products, but is fundamentally defined by it. Bound up in the politics of circulation are the asymmetries of power: between producing nations and the consumers; between producers of crude and those who refine the oil; between those who work on the ships, tank farms, and infrastructures, and those who profit from them; amongst hegemonic leviathans, rising global powers, and those struggling against imperial economic arrangements.
Because so much transportation (on the roads and in the air) and factory production has ceased as a result of the SARS-CoV-2 pandemic, the demand for oil has dramatically dropped. Simultaneously, a pricing war triggered by Saudi Arabia against Russia has flooded the market with oil. The effect of the pandemic on the circulation of oil and its derivative products has been revealing. First and foremost, the pandemic has shown the brittleness of global trade: the very condition of possibility of commerce across the oceans is also what makes it vulnerable to disruption, with ships and airplanes becoming vectors of transmission. This brittleness and unpredictability extends to the trade in oil, but its effects are paradoxical: despite a general lull in global trade, the chartering of tanker ships has expanded, rather than contracted.
The pandemic has also shown that the upstream production of oil is affected by the downstream processes and financial pricings that are usually conceptualized as subsequent to production. This imagined sequencing—production first, sale and transport thereafter—obscures the foundational role of the circulation of oil in defining the very parameters of its production, but also the long reach of its maritime transportation into the financing and pricing of oil.


Financial and Physical Markets
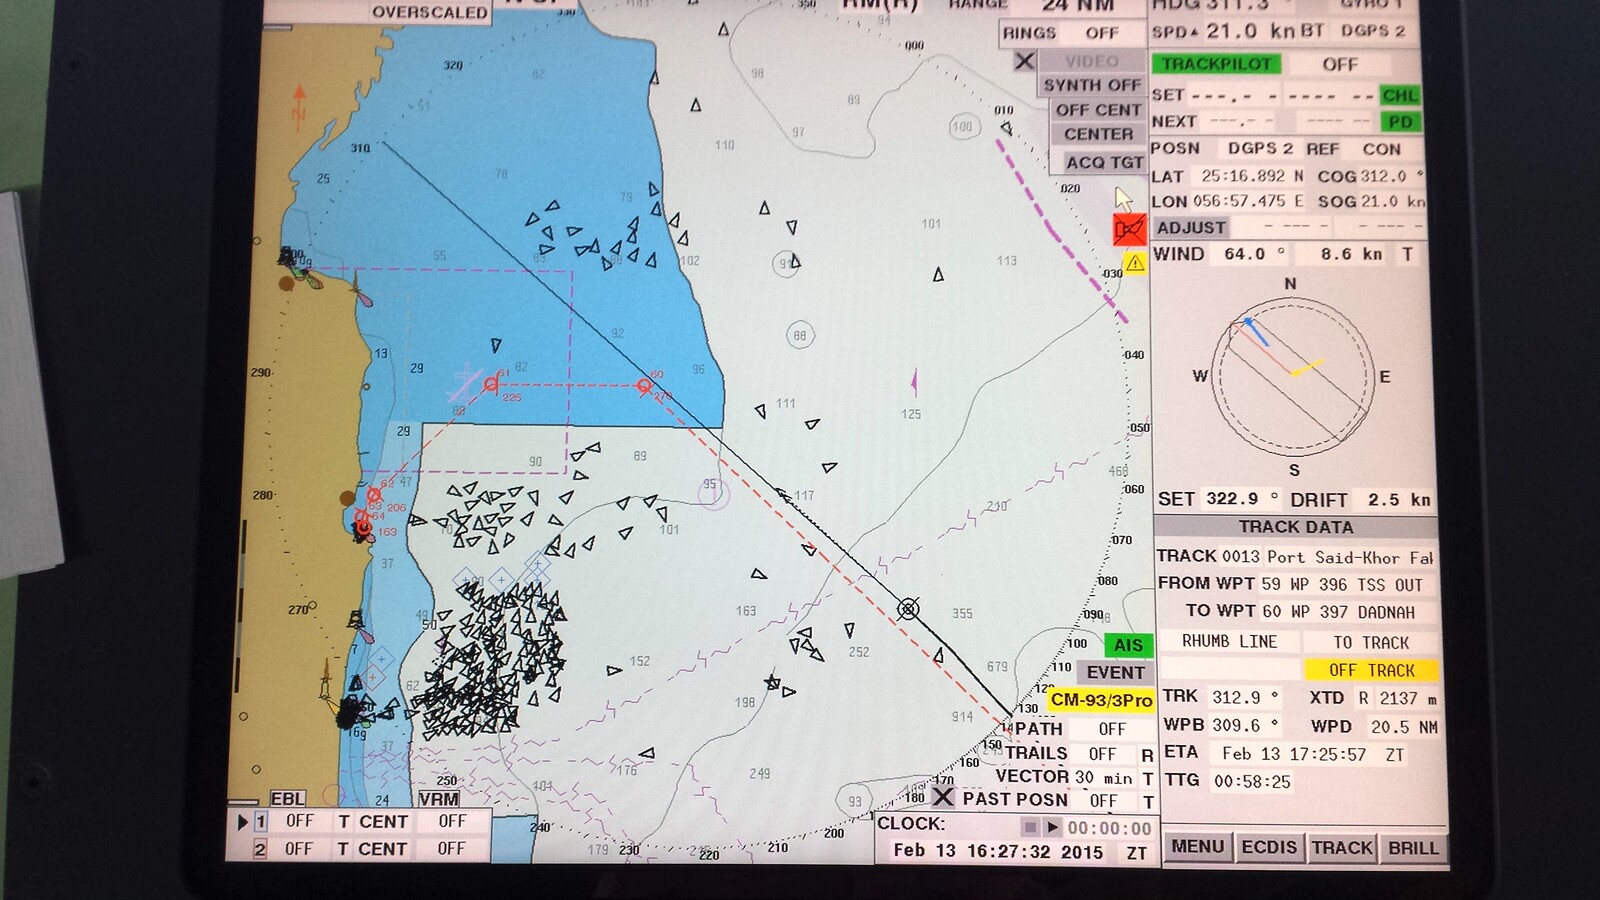
In late April 2020, an image circulated on social media that looked like a screen-capture from a ship-tracking application. These types of apps are commercial products that draw on GPS data and ships’ AIS (Automatic Identification System) to track the movement of vessels across the oceans. They also provide information about what kind of ships the small markers on the map represent (container vessels, bulk carriers, roll-on/roll-off vehicle carriers, and the like), what cargo they carry, a history of that ship, and a map of its current route.
The viral social media image was a map focused on the Western Hemisphere, and showed clusters of tankers along the coasts of Africa, the Americas, and Europe. With the concurrent plummeting demand and rise in production of oil, landside tank farms and storage spaces began to run at or near capacity. Oil producers and buyers were chartering tankers to store oil at sea. Instead of circulating, oil was in stasis.
The map, which was first posted on April 21, 2020, documents a historically unprecedented event, in which the “price” of oil dropped below zero. However, the “price” of oil is not a single number, and does not represent the cost of a universal barrel of oil being traded now or in the future, everywhere or anywhere in the world. Several different benchmarks for oil correspond to the location of their trade (West Texas Intermediate, Brent, Dubai, etc.) and they often differ from one another by a few dollars per barrel, based on specific geographical and political determinants. But the place of production and trade is not the only determinant of oil’s price(s).
Oil prices are complex calculations of the price of oil produced at the moment of trade (the spot price) and the price of oil slated for delivery at a future time (futures price). Oil derivatives are financial instruments that were first devised in 1979 and which bet on the future price of a commodity (or even abstract objects, such as an index of prices of freight) going up or down. These financial instruments affect the pricing of oil even in the spot markets, but they do so unevenly, with differing impact, depending on the price of what kind of product the derivative is betting on. The financialization of oil markets was part of a broader global neoliberal trend from the 1970s onwards, but it was also a direct response to the process of nationalization of oil across the Middle East. Up until this moment of nationalization, oil majors (i.e. the seven massive North American and European oil companies: BP, Chevron, Eni, ExxonMobil, Royal Dutch Shell, Total, and ConocoPhillips) had controlled the price of oil. Now, thanks to its financialization, majors are no longer able to dictate the price of oil on a global market, and these derivatives create speculative tools for the extraction of profit from fluctuations in the price of oil.
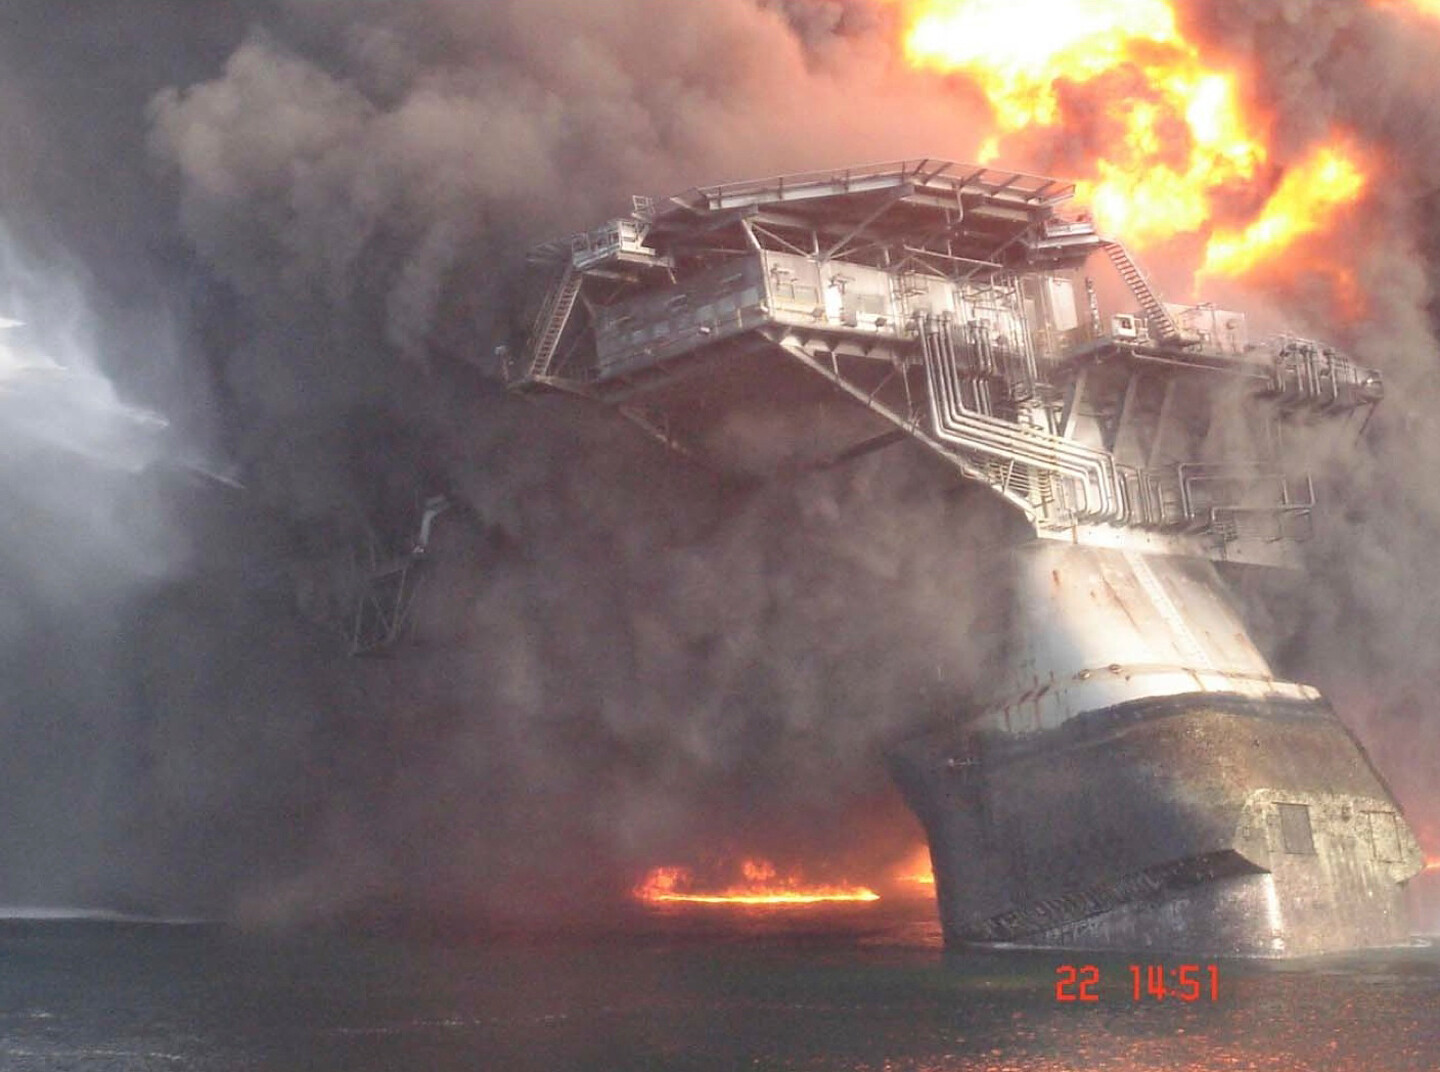
On April 20, as the landside oil storage in Cushing, Oklahoma—a transportation crossroads between the fields of the Midwest and Texas, and the oil terminals of the Gulf Coast—began to fill, and as some futures contracts reached their settlement date of April 21, the futures price of the West Texas Intermediate crude plunged below zero.1 This meant that on April 20, traders of this particular grade and species of oil were actually paying not to take delivery of oil the next day. Derivatives are sometimes portrayed as wholly speculative abstractions, but as Mazen Labban has written perspicaciously, the pricing of oil is “not a dualism between a ‘real’ space-time of material circulation and a ‘fictitious’ space-time of financial representations. Both are real enough and have their own materiality, but each alone is an abstraction incapable of standing in for the oil market.”2 On April 20, this became undeniable. The materiality of the circulation and storage, its inadequacy and limitations, had crashed the futures market. In the days before and after negative oil prices, many shale oil and offshore companies in the US declared bankruptcy.
Cape or Canal Routes
While the computer screens of the financial systems strobed with the plunging prices of most petroleum products on April 20, maritime tracking screens traced the paths of tankers gathering in ever denser clusters near oil and bunkering ports, waiting to load and unload. Ships were anchored along the coast of Venezuela, the Gulf of Mexico, southern California, Mexico, the west coast of Africa, near the straits of Malacca and Hormuz, and all along the shores of East Asia.
Although we cannot know whether these ships are simply acting as storage or were in fact en route, many shipping companies have changed their routes between Europe and Asia as a direct result of the oil glut.3 When the price of oil—and therefore of fuel—drops, and when ships carrying goods—but especially carrying oil—are in no hurry to get to their destination, it becomes cheaper for ships to take longer routes—for example around the Cape of Good Hope, rather than pay the passage fees for the Suez Canal. The longer routes and the “slow steaming” may add a few weeks to the journey itself, but it saves the shipping companies money. These cost savings are balanced against a delay in promised delivery, the possibility of having to wait at anchor before unloading or loading goods, the length of additional time seafarers may have to spend on the ship, and even possible threats to the safety of the seafarers.
I experienced the effects of something like this when travelling aboard containerships, once in early 2015 during a roaring period of global trade, and once in mid-2016 after a dip in global trade.4 During the first journey, the ship’s captain was ordered by the company to steam at maximum speed through the Red Sea, around the Arabian Peninsula and into the Gulf of Oman. The ship, commanded thus, peeled off from the convoy of ships that pass through the Gulf of Aden together as a precaution against piracy, and hugged the coasts of Yemen and Oman in order to cut a few nautical miles out of the route, at very high speed, consuming huge amounts of fuel. On the second journey, with commerce in a lull, any kind of cargo that could earn some profit was needed, and fuel cost savings were more important. As such, midway through the trip, a new port was added to the route so as to add a few more containers for carriage, with the ship all the while steaming at very slow speeds.
More than 500 shipping journeys were cancelled between Asia and Europe or the Americas throughout March or April 2020. Those that did happen tended to have a reduced of containers and traveled along their routes—which themselves changed, shifting toward the Cape—at extremely slow speeds (sometimes at a quarter of the usual ship speed).5 Even ships steaming from the Eastern Mediterranean have chosen to pass through Gibraltar and go around the southern tip of Africa rather than pay the fees for the much more proximate Suez Canal. The Cape route also allows for economies of scale in the transport of goods. The Canal’s depth and width places certain limits on the size of ships passing through it; SuezMax ships are about 275 meters long and have a draft of 12.2 meters. The ships now loading crude from the Ceyhan oil terminal in Turkey are Very Large Crude Carriers (VLCC) or Ultra Large Crude Carriers (ULCC), some with a draft of more than 20 meters and most with lengths exceeding 350 meters.


Crude or Refined Oil
Interactive maritime trackers show ships as static (or glacially moving) markers on a screen and often indicate their origins and destinations. The map from April 21, 2020, however, does not show any of that information. Static maps of maritime vessels obscure the contradictory movements and relations and directions of the ships. We can therefore only speculate why the ships were where they were. And even if so many of these ships were acting as storage, it would not be possible to know their destinations or the timing of their journey. But we do know that just as bulk and container ships were cancelling trips, or steaming half empty, the cost of chartering tankers doubled as both producers and traders turned to storing oil on ships. At some stage in mid-April, the cost of chartering a ULCC was up to $350,000 per day, double what it had been a scant few weeks before.
In the April 21 map, some ships are pointed away from Nigeria or Venezuela and seem to be steaming towards the Cape of Good Hope, presumably on their way to Asia. China imports the vast majority of its oil—90% of it—by sea, but China is nowhere near the largest global consumer of oil.6 The US consumed 20% of all the oil produced worldwide, whereas China only takes 13.5%.7 The April 21 map cannot, therefore, be taken as a snapshot of global oil.
The US both exports and imports petroleum.8 Much of what US imports arrives through pipelines from Canada or Mexico and is intended for its refineries which are configured to process particular kinds of oil (heavy/light, sour/sweet) that are produced in specific oil fields. The proliferation of these refineries also distinguishes the US consumption of oil from that of China. US refining capacity outstrips that of all other countries (Texas alone has higher refining capacity than all of China)—but more importantly, its refineries produce products which garner higher market prices. As such, US refineries’ conversion capacity to value-added products far outstrips all other countries. This means that even if the entirety of the Asia Pacific has a comparable general refining capacity to the US, US conversion capacity, and therefore its extraction of value, is higher. Why does this matter for maritime transport?
Those VLCCs and ULCCs that often only carry crude oil depend on an extractive economy and trade in raw materials, a hallmark of colonial economic relations. The chartering of a broader range of ship sizes indicates the extent to which, beyond the economies of extraction, value-added products produced through refining and processing has aided the accumulation of capital in the global North. Indeed, in the aftermath of the nationalization of oil in the Gulf in the 1970s, many of these countries turned to increasing their refining capacity as a means of escaping the extractive economy and acquiring petrochemical manufacturing technology and know-how. The 1970s nationalizers were not fiery revolutionaries seizing control of US or European oil companies as in decades past in places like Iran or Mexico, but technocrats from producing nations of the Gulf negotiating the buyout of their national oil from North American and European oil majors.
These technocrats, however, understood the benefits of downstream value-added production and control over the circulation of their own products. In a fascinating account of a failing shipyard in Belfast in 1975, a sales representative of the ship yard, “back from a sales tour of Saudi Arabia, Kuwait, Abu Dhabi and Iraq,” said that instead of large tankers, the Arabs wanted smaller vessels to carry refined petroleum products such as kerosene and gasoline. “They won’t need them until four or five years from now,” he said, “when they will have the refining capacity to make the products.”9 As Walter Rodney has written, the emphasis on trade of raw materials, rather than on production of more expensive manufactured goods, privileged traders over producers, delayed technological innovation, and led to economic stagnation and intensified exploitation of both humans and natural resources.10
Economic development is a double-edged sword. Both the production and circulation of petrochemicals have dramatic ecological effects. The same shale oil which has, since the deregulation of fracking, boosted the position of US as an exporter of oil, also leads to the devastation of groundwaters, soil, and spaces inhabited by indigenous peoples. The indigenous and first nations people of the Americas have been struggling against devastating extractive industries defacing and destroying their lands for decades. Most recently, however, the Water Protectors of Standing Rock (since 2016) and their Wetʼsuwetʼen counterparts further north (in 2019 and 2020) have campaigned for the cessation of construction of pipelines across their lands. The struggle of the Water Protectors of Standing Rock, however, was crushed by the force of militarized police, while the Wetʼsuwetʼen campaign—which included a widely-supported blockade of logistical lines—has been momentarily deferred because of the pandemic.11
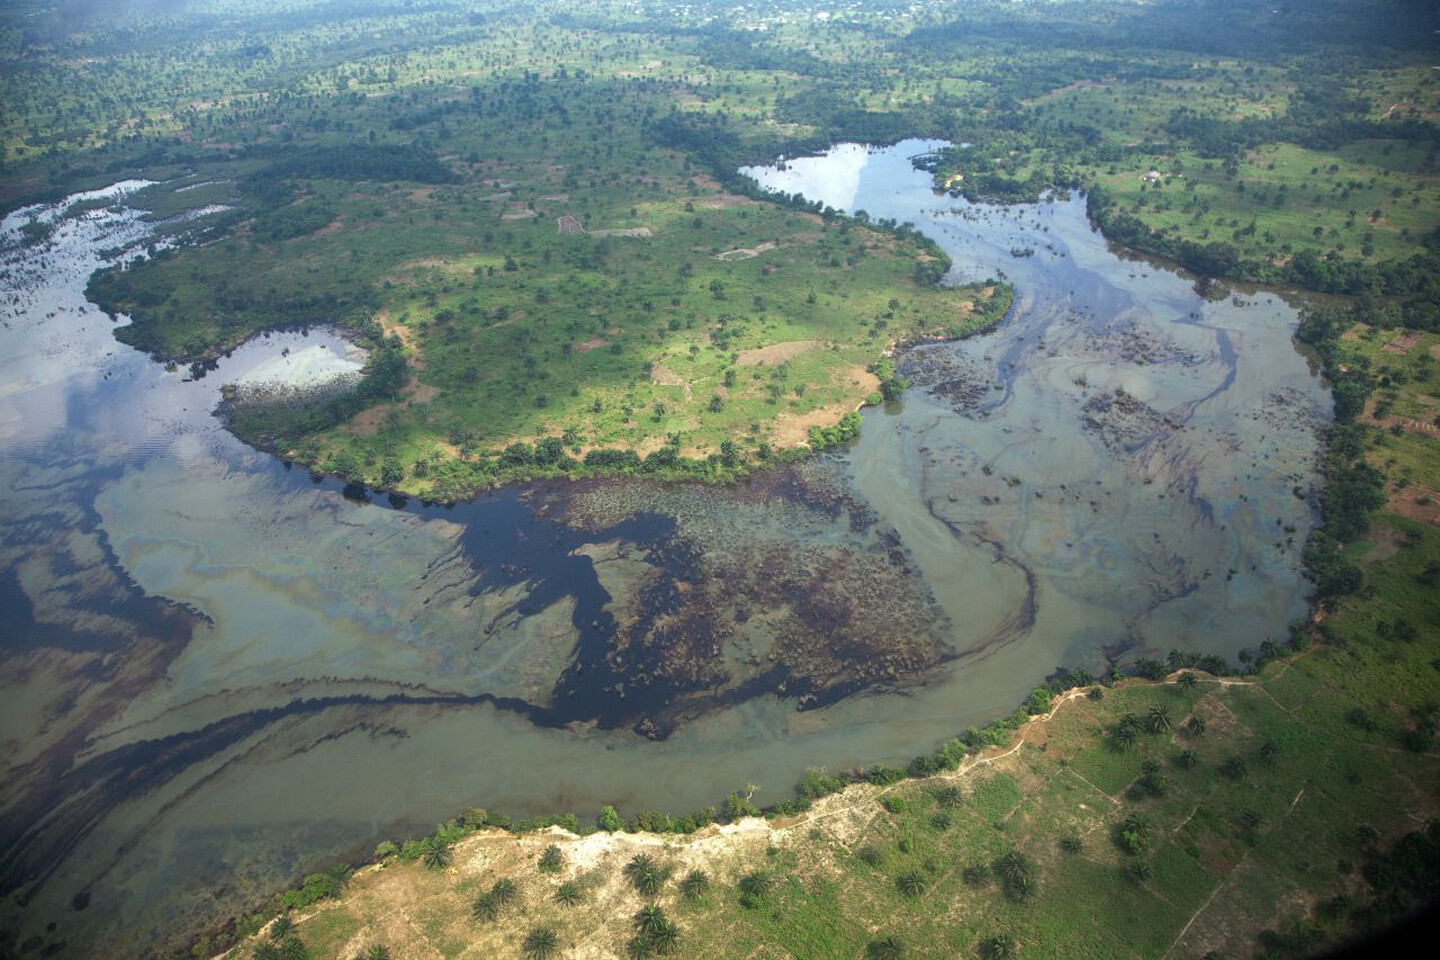
Maritime transportation of oil also can devastate the environment. Tanker transport is responsible for least a quarter of all oil spills at sea.12 And aside from catastrophic large-scale oil spills, ship collisions or groundings can lead to the leakage of oil and petroleum products during loading and unloading. On oil-rich coasts around the world, beaches are often strewn with lumps of tar that have formed at sea and washed ashore. Ships can release ballast water in unregulated ways, and although ballast tanks and oil or fuel tanks are supposed to be separate, dirty ballast water, released in unregulated or lightly regulated ports, can introduce dangerous pollutants into the marine environment. Ships also produce enormous air pollution. If they are at anchor for days, even weeks, on end, the chance of their illicit discharge of all sorts of waste will also increase in such seas, and their engines will inevitably produce oxides of carbon and nitrogen, sulphur compounds, and particulate matters.
The tumbling of global trade, the closure of borders, the historically high unemployment, and therefore plummeting demand for oil wrought by the pandemic all sketch the contours of a shifting context for maritime movement of oil. But the real levers of transformation are political. In response to the pandemic, businesses are consolidating their positions and policymakers are rallying around capital to ensure that any retrenchment does not subvert the processes of accumulation. As trade has been hobbled, various states such as France and South Korea have bailed out their oil and shipping companies.13
As has been true with fracking, pipeline-building, value-extraction through refining, and soaring exports, the US continues to strive for maintaining the hegemonic role of the greatest consumer and one of the greatest producers of oil (and also, inevitably, the greatest polluter). China and India, meanwhile, are slowly taking up the oceans of oil stored at sea as their factories slowly reopen. The midwife of this new post-pandemic age will not be the changes produced temporarily by the pandemic: capital is remarkably resilient in the face of crisis, even successive ones. Any real transformation—in how we produce and circulate and consume energy, in who benefits and who suffers from the effects of production and circulation of petroleum and its products—can come only through concerted political action: one that binds together a stewardship of the earth and its oceans with demands to dismantle global asymmetries of power.
The West Texas Intermediate is one particular benchmark, which as Labban has pointed out represents “insignificant shares of the market.” Mazen Labban, “Oil Spill: Inside the Global Market for Crude”, The American Prospect, April 28, 2020, ➝.
Mazen Labban, “Oil in parallax: Scarcity, markets, and the financialization of accumulation,” Geoforum 41 (2010): 541–552.
“Record Number of Box Ships Take Longer Cape Route as Bunker Prices Slide,” Ship and Bunker News, May 6, 2020, ➝.
When researching my book on maritime transportation infrastructures. Laleh Khalili, Sinews of War and Trade (London: Verso, 2020).
“Oil and Petroleum Products Explained: Oil Imports and Exports”, U.S. Energy Information Agency, April 27, 2020, ➝; Yao Wang and Jing Lu, “Optimization of China Crude Oil Transportation Network with Genetic Ant Colony Algorithm,” Information 6 (2015): 467–480.
Eni, World Oil Review 2019 Vol 1. (Rome: Eni SpA, 2019), 18; BP, Statistical Review 2019 (London: BP, 2019), 9, 13.
In 2019 the volume of US imports and exports of oil were almost equivalent (9.1 and 8.5 million barrels of oil per day). “Oil imports and exports”, U.S. Energy Information Agency.
“Huge Belfast Shipyard May Shut” in New York Times, November 8, 1975, ➝.
Walter Rodney, How Europe Underdeveloped Africa (London: Bogle-L’Ouverture Publications, 1972).
See Winona LaDuke and Deborah Cowen, “Beyond Wiindigo Infrastructure,” South Atlantic Quarterly 119, no. 2 (2020): 243–268; Standing with Standing Rock: Voices from the #NoDAPL Movement, eds. Nick Estes and Jaskiran Dhillon (Minneapolis: University of Minnesota Press, 2019).
Roy Facey, “Pollution from sea-based sources,” in Protecting the Gulf’s Marine Ecosystems from Pollution, eds. Abdulaziz H. Abuzinada et al. (Basel: Birkhäuser, 2008), 166–178.
Costas Paris, “Troubled Shipping Lines Turn to State Support,” Wall Street Journal, May 22, 2020. Meanwhile, as a number of independent fracking and offshore companies in the US have declared bankruptcy, the US federal government has reduced oil royalty payments for companies drilling on federal lands, while imposing retroactive fees on producers of wind and solar energy.[footnote Will Englund and Dino Grandoni, “Oil companies drilling on federal land get break on royalties. Solar and wind firms get past-due rent bills,” Washington Post, May 20, 2020.
Oceans in Transformation is a collaboration between TBA21–Academy and e-flux Architecture within the context of the eponymous exhibition at Ocean Space in Venice by Territorial Agency and its manifestation on Ocean Archive.
Category
Oceans in Transformation is a collaboration between TBA21–Academy and e-flux Architecture within the context of the eponymous exhibition at Ocean Space in Venice by Territorial Agency and its manifestation on Ocean Archive.