Accumulation - Cymene Howe and Dominic Boyer - Redistributions

Redistributions: From Atmospheric Carbon to Melting Cryospheres to the World Ocean

Cymene Howe and Dominic Boyer

Glacier. Fláajökull, East Iceland.

Accumulation
September 2018

Accumulation figures prominently in the environmental concerns of the twenty-first century. Greenhouse gases accumulate in the atmosphere. Toxins accumulate in biomes. Plastic accumulates on land and sea and in avian and aquatic forms of life. Waste accumulates on the margins of settlements and industry. These forms of accumulation are closely tied to the northern capitalist modernity whose world hegemony was achieved through colonialism and imperialism. Accumulation marks this modernity’s relentless work to constitute and drain resource frontiers, its making of things wildly in excess of need, its solicitation of avid and restless consumption, and its obscuring of the limits and consequences of a growth- and luxury-oriented economy.

Accumulation originated as a concept in early modern Europe as part of a new lexicon related to the growth of the thingly world. Literally, “accumulation” meant the act of making heaps. Our contemporary concern with heaping maintains this broader attention to thingly amassment—beyond environment, we live also in a time of mounting awareness of the efficacy of growing heaps of capital, weapons, income, and power. Yet as much as some heaps are coming together, other heaps are coming apart. And still other things are undergoing phase shifts in reaction to other modes of physical and social accumulation. For if there is one thing not accumulating in the twenty-first century, it is ice.

Ice. Okjökull, Western Iceland.

Dis-accumulation by Accumulation

Over the last two decades, ice has become a climatological signal, rendering visible the rising temperatures of anthropogenic climate change. In melting ice both heat and its carbon source are made visible. Diminishing cryospheres have become observable, materialized sites of atmospheric accumulation, as greenhouse heat works its way across and through the bodies of ice forms. Put another way, accumulation in the atmospheric domain creates dis-accumulation in the cryosphere.

Polar ice melt is widely understood as the key index that temperatures at the planet’s axes are increasing dramatically. And ice is melting nowhere faster, and faster than expected, than in the Arctic region.1 The Intergovernmental Panel on Climate Change (IPCC) considers glacial diminishment to be the “highest confidence temperature indicator in the climate system.”2 Scientists have also concurred that the rate of melt in polar zones has been considerably underestimated.3 The transformation of the world’s ice, and the implications of this cryo-human outcome are vivid indicators of what Timothy Morton has called the “Age of Asymmetry.”4 However, the asymmetrical distribution of climate crises, and the skewed centers of power and resource exploitation that have created them, also reveal a kind of symmetry: an equation between melting cryospheres and carbon intensive modernities.

Few places on earth have experienced the great melting more dramatically than Iceland, where ten percent of the island’s surface is covered by over 400 glaciers and ice caps. Since human settlement in 874, glaciers have played an important role in Icelandic culture and history, most often as ominous presence, threatening to displace villages with encroachment or destroy homes and farms with glacial outburst floods.5 Iceland’s glaciers are now losing 11,000,000,000 tons of ice per year, and scientists predict that by 2170 all of the country’s glaciers will be gone.6 In their disappearance, Icelandic glaciers index atmospheric temperature elevation. As they recede, failing to re-grow and re-accumulate their mass, they become observable signs of atmospheric carbon dioxide accumulation that global capitalist modernity has abetted and accelerated.

Glacial lagoon. Jökulsárlón, East Iceland.

As glacial ice expires and sea ice diminishes in its extent and thickness, a familiar extractive logic has also come to occupy the Arctic region. New shipping routes are being cleared by sea-ice loss and mineral stores are becoming more easily accessible to mining.7 The Arctic appears steadily poised as a new frontier for extraction, commerce, and development in the high North. Yet media attention about the melting Arctic often emphasizes the potential for sea level rise in the lower latitudes. Or, in more locally attentive reporting, it highlights the catastrophic conditions facing Indigenous communities and subsistence hunters who rely on seasonal freezing and ice pack for their livelihoods. Thus, while melting cryospheres tend to focus worry upon future harm, some responses have lauded the potential for increased capital accumulation created through lost ice. Some Greenlanders, for instance, have embraced ice reduction because it will increase access to mineral and hydrocarbon resources.8 Several Icelandic politicians have likewise celebrated the possible economic windfall of the great melting, arguing that warmer conditions represent a boon for northern nations because this will make agriculture and resource extraction more practical and economically viable.

The Northern Sea Route—which was previously passable only four months of the year—was traversed in 2017 for the first time by shipping vessels without an ice breaker. By 2040, parts of the passage are expected to be entirely free of sea-ice year-round with far-reaching consequences for local populations and ecosystems. The logistics hub for this Northern Sea Route has been slated for construction in northern Iceland, and will be funded in part by Chinese investors.9 As ice recedes on land and on the sea’s surface, hydrocarbon exploration and extraction are projected to increase. However, little infrastructure is in place to treat oil spills or other accidents if the 25% of the world’s remaining carbon fuel reserves located in the Arctic are to be extracted. The consequences of burning these carbon reserves of course, have implications far beyond the Arctic. While the polar North continues to shed its icy skin and reveal to the world the rapidity of climate warming, it is also a place where capital accumulation is being re-made in the wake of cryospheric dis-accumulation.

The Motility of Glaciers

Each summer, Professor Gu∂finna A∂algeirsdóttir journeys to Sólheimajökull, a glacial tongue about two hours southeast of Reykjavík, with a group of university students. There, they use a steam drill to bore through glacial ice, a process that Gu∂finna describes as sinking a hot knife through butter. Once pierced, a long wire is lowered down ten meters into the body of the glacier. As snow and ice on the glacial surface accumulate, compact, and then melt away, Gu∂finna and her students are able to observe the diminished thickness of the ice. The more visible wire that emerges from the narrow hole, the less ice is present. Gu∂finna describes it as a very simple, low impact way to measure ice that once was.

Glaciologists are keenly attuned to accumulation as a technical term in their scientific practices. Accumulation is what makes a glacier a glacier. It is what gives a glacier not just mass, but movement. Gu∂finna explains that glaciers are anything but static. In fact, she says, they are best understood as operating like a conveyor belt. They move, and they move material. Snow and ice accumulate in the higher altitudes of the glacier and are depleted in the lower reaches. Frozen materials move from high to low, and from solid to liquid. Glacial vitality, its ability to move under its own enormous weight, is determined by accumulation in the colder months, offset by the “ablation” processes of melting and calving in the warmer months. Of course, there are many more warmer months now, and fewer cold. Accumulation has thus slowed, while melt has accelerated.

Accumulation. Okjökull, Western Iceland.

Helgi Björnsson, Iceland’s most famous glaciologist, has found it useful to depict glaciers in economic terms. “They are like a bank account,” he says. In the winter, positive accumulation on the surface fills up the bank. Deposits are made at higher elevations, while at lower elevations, withdrawals occur. And just as you would your accounts, he notes, you want to keep it in a healthy balance. But we know that balance is not being achieved as of late; deposits have not kept up with expenditures. Accumulation has fallen behind depletion.

Icelandic glaciers are especially well documented compared to many others in the world. Since the middle ages, Icelanders have been attuned to the glaciers that occupy their homeland. Historically, the country’s ice cover has varied. But since the mid 1990s, ice forms have only gone in one direction: towards “ablation.”

Ablation is the technical term for ice loss. In English, the word is, in the first instance, defined as “the surgical removal of body tissue.” (The first person to systematically document Icelandic glaciers was, by trade, a surgeon.) In the second definition, ablation denotes the melting or evaporation of snow and ice. In general, and historically, about half of ablation events occur through calving (cracking off of ice forms) and the other half through melting. While there have always been advances and retreats of glaciers in Iceland, the country’s glaciers are now withdrawing to the point where “new land” is being uncovered by melt. Places that have been covered in ice for at least 2–3,000 years are now exposed and raw.

Glaciologists are experts inglacial response.” In Iceland, and elsewhere, glaciologists recognize, for example, that Earth systems have only accumulated about 150 years of intensive fossil fuel use. Glacial response to atmospheric temperature is just beginning because, as both Gu∂finna and Helgi put it, it “is a slow system.” It is also a “stochastic” system—with random probabilities and patterns that may be analyzed statistically but that cannot be predicted precisely.

Prior to the Fourth Assessment Report of the IPCC, glaciers and ice-sheets like those in Greenland and Antarctica appeared in many diagnostic modelling tools as “white mountains,” according to Gu∂finna. Rather than the dynamic systems that they are—cracking, melting and moving—their representation in climate modelling took them as inert surface protrusions. But of course, ice sheets and glaciers are increasingly motile; they are dynamic entities that, among other things, are contributing to sea level rise and changing weather. “The climate models have really not managed to consider all of the physics,” Gu∂finna explains. Indeed, as she put it, “This is the largest uncontrolled experiment that we humans have ever done.”

Melt is shape, not flow

Earth scientists agree that melting land ice is contributing significantly to sea-level rise (SLR) around the world and that continued warming will exacerbate the risks for human populations. The IPCC has reported the likely increase in sea level from the end of the 1900s to the year 2100 will be between 18-59 centimeters. But more recent modeling shows that land ice is melting faster than previously expected, and many climate experts now believe that an overall sea level rise of one meter worldwide by the end of the century is more realistic. While these designations are valuable for estimating future potential harm and perhaps more importantly, for alerting populations to sea level threats, these diagnoses are limited in that they speak to a global condition—an average—while their consequences will be registered in specific locations—and to highly variable effect.

Many popular accounts of cryospherically-induced sea level rise reproduce the most simplistic accounting of sea level rise, “the median global sea level.” For scientists, this is colloquially termed “the bathtub model”—essentially, that meltwater entering into the world ocean will manifest in a linear, uniform way and distribute evenly across the world’s coasts.10 This is inaccurate for several reasons, including the fact that local sea levels are determined by myriad factors, including land composition (erosion, subsidence, sediment compaction and bedrock porosity), weather (storms, wind and air pressure distribution), ocean circulation (waves, tides, currents and the global ocean conveyor), and finally, global sea level fluctuation caused by thermal expansion and melting land ice.11 Sea level rise in particular locations will be contingent; what is constant is that hydrological changes will affect every place on Earth.

As melted ice becomes integrated into the world ocean, the planet’s gravity, as well as its rotation, are shifted and create spatial patterns of sea level rise distribution around the world.12 Until very recently, the relationship between future changes to Earth’s cryosphere and its impact upon local sea-level shifts (or sea level “fingerprints”) have made precise forecasting for coastal cities difficult. In late 2017, physicist Eric Larour, working with a team of researchers at NASA and the Jet Propulsion Lab, created and released online an interactive modeling tool—a gradient fingerprint mapping device (GFM)—that shows, with great accuracy, where freshwater melt contributions to global sea level rise are being distributed among 293 coastal cities.13 The NASA/JPL program is currently the only tool capable of attributing specific locations of melting ice with their effects on the world’s coastal cities.

The locus of watery inundation depends on the location of ice loss. For example, local sea level rise in London is significantly affected by changes on the western part of the Greenland Ice Sheet (GrIS). Conversely, New York City’s sea level rise will be largely contingent upon changes to the northeastern portions of the GrIS. Implementing an advanced mathematical property, the GFM computational model creates a mesh to combine shoreline database material and “ice forcing” measurements from 2003 to the present, gathered by the GRACE satellites.14 The modeling tool can then render local sea level changes as they relate to local variations in ice thickness for all of the world’s ice drainage systems, from Antarctica to the Alps and from the Siberian Arctic to the Andes.

A plot of Icelandic contributions to sea level rise in micrometers per year across the planet, from four different views. The upper left, upper right, and lower left focus on the maximum contribution (in the Atlantic, Northern Pacific) while the lower right image focuses on the minimum contribution (between Australia and Antarctica). Generated by Eric Larour, May 25, 2018.

The model, however, does not follow the water from sites of melt to sites of rise. Instead, it captures the shape of the ocean, tracking its gravitational perturbations in form as ice becomes water, becoming ocean. In conversation, Eric, the tool’s creator, puts it plainly: “Melt ice anywhere and we can give you the shape that the ocean would adopt.” He explains that the most complicated aspect is “sea level rotational feedback,” or the change in the rotation of the Earth as ice melts.

It’s like a spinning top. If you could modify the spinning top while it rotates, maybe touch it and remove some mass, it will start wobbling very differently… [A]s soon as you remove a bit of mass from that big giant spinning top, which is the Earth, the rotation axis of the spinning top wants to move towards the mass that was lost.

Accumulation does not appear here through flow, but through redistributions of mass.

In a circulatory model, accurately charting the movement of one molecule of melted water to its final destination could take up to hundreds of years of observation. The ocean conveyor is not slow per se, but it is very circuitous, hemmed and pushed by many factors. A connection between melt (here) and rise (there) thus exists, but not through a flow of melted water in one site to sea level rise in the other. The dis-accumulation of ice can be directly tied to its accumulation as sea level rise elsewhere, but precision in this operation requires a volumetric understanding of the Earth’s fluid envelope at scale, and in its distributive mass rather than its linear connectivity.

Glacial melt beach. Fláajökull, East Iceland.

Conclusion

In a recent collection championing the “volumetric turn” in architecture, geography, and anthropology, Franck Billé argues that critical attention to the materiality and multiplicity of volumetric space helps to jam governing conceptions of cartography through sometimes unruly “entanglement of scales,” from the planetary to the nano.15 If we might extend this argument further, by engaging with the entangled sociomaterial transformations of hydrospheres, lithospheres, atmospheres, and cryospheres, we gain new kinds of critical insight and leverage upon the dominant political orders of contemporary northern modernity such as: (1) the fossil and nuclear fuel infrastructures that enable all dimensions of modern lifestyle, worldview and governance; (2) nation-state sovereignties that exercise their dominion principally through militarized terralogical systems of citizenship, extractive economies, and border control; and (3) the financial networks whose electronically mediated forms of speculation, debt imposition and value extraction avidly imagine themselves as transcending space, matter, and time. These are all complex, ramifying systems on their own and they often interlock and reinforce one another in the anthropocene/capitalocene trajectory. They are furthermore relentlessly anthro/androcentric and resist recognizing the material contingencies of their forms of power, let alone the calls to ecophilia that are spreading and strengthening in response to the compromise of human and nonhuman lifeworlds.16 The challenge of changing our current trajectory is, needless to say, immense and must be viewed as civilizational transformation. Only by better understanding the interconnection and redistribution of accumulations between atmospheric carbon, cryospheric mass, hydrospheric shape, and anthrospheric forms of knowledge and value can we contribute to the work of this transformation.

Notes
1

See .

2

J. T. Houghton, Y. Ding, D. J. Griggs, M. Noguer, P. J. Van der Linden, X. Dai, K. Maskell, and C. A. Johnson, “Climate Change 2001: The Scientific Basis, summary for policy makers—contribution of working group I to the third assessment report of the Intergovermental Panel on Climate Change.” (Cambridge: University of Cambridge Press, 2001).

3

The 2017 Arctic Monitoring and Assessment Programme report detailed that global sea levels will rise much more quickly than previously thought; the new estimates are almost double the pace predicted by the IPCC in 2013. .

4

Timothy Morton, Hyperobjects: Philosophy and Ecology after the End of the World (Minneapolis: University of Minnesota Press, 2013), 161.

5

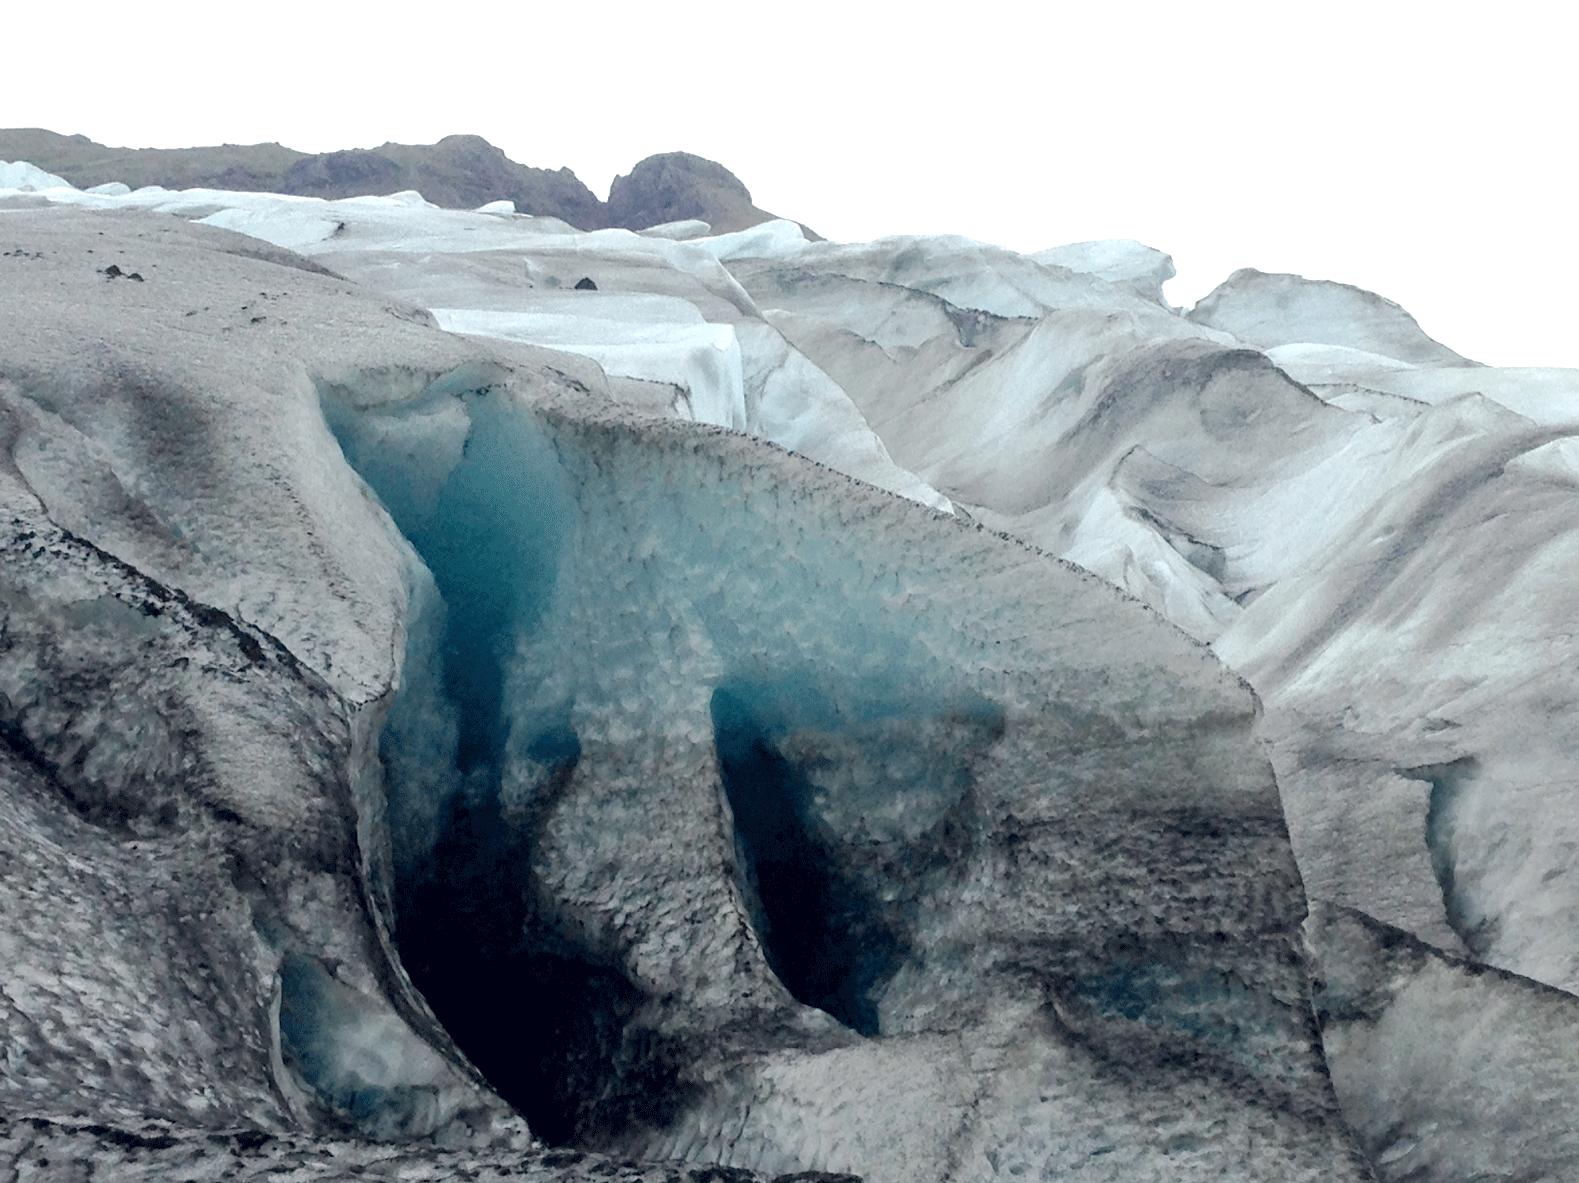
By definition, glaciers are formed where winter snowfall accumulation exceeds that of summer melting or calving, allowing snow to amass on the surface and eventually become ice. Critical thickness for glacier formation is approximately 30 meters with a density of 0.85 g/cm3. When these conditions are achieved, the existing ice deforms and moves downslope to become a glacier. Iceland is dominated by six primary glaciers. See Ingólfur Ásgeir Jóhannesson, “Icelandic Nationalism and the Kyoto Protocol: An Analysis of the Discourse on Global Environmental Change in Iceland.” Environmental Politics 14(4) (2005): 495-509.

6

See Cheryl Katz, “What is Iceland Without Ice?,” Scientific American, December 18, 2013. Nearly half of the world’s terrestrial glaciers are located in the Arctic region.

7

See Rasmus Gjedssø Bertelsen and Piotr Graczyk, “Establishing Shared Knowledge about Globalization in Asia and the Arctic,” Cultural Anthropology, July 29, 2016, ; and Diplomacy on Ice: Energy and the Environment in the Arctic and Antarctic, eds. Rebecca Pincus and Saleem H. Ali (New Haven: Yale University Press, 2015).

8

See Mark Nuttall, “Subsurface Politics: Greenlandic Discourses on Extractive Industries,” in Handbook of the Politics of the Arctic, eds. Leif Christian Jensen and Geir Hønneland (Cheltenham: Edward Elgar, 2015): 105–127; and Mark Nuttall, “The Making of Resource Spaces in Greenland,” Cultural Anthropology, July 29, 2016. .

9

Formerly called the Northeast Passage, the Northern Sea Route traverses the Eastern Arctic seas and connects the Atlantic and Pacific oceans. In the past it has been free of sea ice only two months out of the year. Seasonal variation in the Artic is considered to be more extreme than anywhere else on earth, moving from ice-cover to lush conditions in annual cycles. The Arctic Ocean, surrounded as it is by land, is more subject to terrestrial influence than any other ocean on the planet; its hydrology is singular, on the one hand encircled by land and on the other, fed by some of the world’s largest rivers. See National Research Council, The Arctic in the Anthropocene: Emerging Research Questions (Washington DC: The National Academies Press, 2014).

10

We intentionally adopt the oceanographic term “world ocean” to emphasize that this is a continuous body of water encircling the Earth, with relatively uninhibited interchange and transference across the world hydrosphere. Human designations of “the {Atlantic, Pacific, Southern, etc.} ocean” or “sea” may be useful geographic markers for human-imagined demarcations, but the Earth’s fluid envelope is not similarly bounded.

11

.

12

Scientists have demonstrated that terrestrial ice melting into the ocean creates a non-uniform pattern of regional sea level rise which can be tracked using “sea level fingerprints.” Recently, it has been shown that ocean station measurements of sea level fingerprints correspond with that calculated from satellite measurements, which are able to determine ocean mass changes over time in local settings, accounting for gravitational fluctuation. See Chia-Wei Hsu and Isabella Velicogna, “Detection of sea level fingerprints derived from GRACE gravity data,” Geophysical Research Letters 44, 17 (2017): 8953–8961.

13

. See also Eric Larour, Erik R. Ivins, and Surendra Adhikari “Should coastal planners have concern over where land ice is melting?” Science Advances 3, 11 (November 15 2017).

14

. A joint effort by NASA and the Deutsche Forschungsanstalt für Luft und Raumfahrt (DLR) in Germany, GRACE (Gravity Recovery and Climate Experiment) satellites, launched in 2002, are now operating under “an extended mission” phase. GRACE is comprised of two spacecraft, 220 kilometers apart in a polar orbit, 500 kilometers above Earth. The objective of GRACE is to map the Earth’s gravitational field by accurately measuring the distance between the two satellites, using GPS and microwave signals. GRACE satellites have provided data on: changes due to surface and deep currents in the ocean; runoff and ground water storage on land masses; exchanges between ice sheets or glaciers and the ocean; and variations of mass within Earth. GRACE is also being utilized to better profile Earth’s atmosphere, and the project overall is seen to be making very significant contributions to NASA’s Science Mission Directorate, Earth Observation System (EOS) and global climate change studies. P. Wessel, and W. H. F. Smith, “A Global Self-consistent, Hierarchical, High-resolution Shoreline Database,” Journal of Geophysical Research 101, #B4 (1996): 8741–8743; and Michael M. Watkins, David N. Wiese, Dah-Ning Yuan, Carmen Boening, and Felix W. Landerer, “Improved methods for observing Earth’s time variable mass distribution with GRACE using spherical cap mascons,” Journal of Geophysical Research 120, 4 (2015): 2648–2671.

15

Franck Billé “Introduction: Speaking Volumes,” Cultural Anthropology, October 24, 2017, .

16

See Timothy Mitchell, Carbon Democracy: Political Power in the Age of Oil (London: Verso, 2011). And Stacey Alaimo Exposed: Environmental Politics and Pleasures in Posthuman Times (Minneapolis: University of Minnesota Press, 2016).

Accumulation is a project by e-flux Architecture and Daniel A. Barber produced in cooperation with the University of Technology Sydney (2023); the PhD Program in Architecture at the University of Pennsylvania Weitzman School of Design (2020); the Princeton School of Architecture (2018); and the Princeton Environmental Institute at Princeton University, the Speculative Life Lab at the Milieux Institute, Concordia University Montréal (2017).

Category
Nature & Ecology
Subject
Arctic and Antarctic, Climate change, Water & The Sea, Anthropocene
Return to Accumulation

Cymene Howe is Associate Professor of Anthropology at Rice University and the author of Ecologics: Wind and Power in the Anthropocene (Duke) as well as co-editor of Anthropocene Yet Unseen: A Lexicon (Punctum). She co-hosts the weekly Cultures of Energy podcast.

Dominic Boyer is Professor of Anthropology at Rice University and Founding Director of the Center for Energy and Environmental Research in the Human Sciences, the first research center in the world designed specifically to promote research on the energy/environment nexus in the arts, humanities and social sciences.

Advertisement
Subscribe

e-flux announcements are emailed press releases for art exhibitions from all over the world.

Agenda delivers news from galleries, art spaces, and publications, while Criticism publishes reviews of exhibitions and books.

Architecture announcements cover current architecture and design projects, symposia, exhibitions, and publications from all over the world.

Film announcements are newsletters about screenings, film festivals, and exhibitions of moving image.

Education announces academic employment opportunities, calls for applications, symposia, publications, exhibitions, and educational programs.

Sign up to receive information about events organized by e-flux at e-flux Screening Room, Bar Laika, or elsewhere.

I have read e-flux’s privacy policy and agree that e-flux may send me announcements to the email address entered above and that my data will be processed for this purpose in accordance with e-flux’s privacy policy*

Thank you for your interest in e-flux. Check your inbox to confirm your subscription.