At The Border - Cindy Lin - How to Make a Forest

How to Make a Forest

Cindy Lin

A satellite image used by data technicians to classify palm oil plantations in Kalimantan.

At The Border
April 2020

In Pursuit of a Single Map

Munir is a 23-year-old high-school-educated data technician hired by a private geospatial mapping company in Bandung, an urban provincial capital on the island of Java, Indonesia to produce topographic maps. He is one of a team of technicians working under sub-contracts from the National Mapping Agency to draw squares and rectangles around vast swaths of building and property across the archipelago. Sitting with Munir, I notice him staring at pixels instead of satellite images. Scaled to 1:25,000, Munir uses his mouse to quickly click and draw a perimeter around what I learn are roofs. The roofs are located in Temajuk, a coastal city on the island of Kalimantan, a region that has witnessed the world’s fastest forest clearing rates since 2012, as the oil palm sector has expanded across rural Indonesia.

I ask Munir, “Why not zoom in?” thinking this would ensure his clicks are made with more precision so that nothing is missed. He tells me “My boss wants us to work fast.” He then explains that zooming in would give him and his colleagues too much content to work with. Even if state agency scientists demand that every building is drawn, his supervisors are afraid that the technicians will interpret too much. Every minute in their office facilities, on their computers, and software counts for a pool of technicians, paid far too little to meet the agency’s ambition for an archipelago to be remapped.

Munir attempts to redraw multiple roofs with limited time.

During regular three-month-long field surveys to plantation frontiers like Temajuk, Munir and his colleagues cross-reference the maps they plotted in the office. The exploited terrain poses a danger to the visiting technicians as they tread on eroded and restricted hills, succumb to dislocated knees, and negotiate diffuse threats of death and injury. This work is not easy. Most of them are paid 3 million rupiah (~US$200) monthly, four times below the average income in Bandung. Munir shrugged when I asked about his wages, reasoning that maps are crucial for Indonesia’s “pembangunan” (development), an ever-shifting ideology that has haunted the nation since its plans for rice self-sufficiency began in the 1950s.1 Yet Munir and his fellow technicians insisted that opportunity resides in their deskwork and field surveys as direct participants in state forestry protection. The technicians’ remediation of pixels provides these lower-class men, migrants from rural Indonesia to urban Bandung, a mobility and positionality otherwise out of reach.

The contract employing the technicians stemmed from an incident in December 2010, when former Indonesian President Susilo Bambang Yudhoyono compared two conflicting maps of Papua Island. The two forest maps, one published by the Ministry of Forestry and the other by the Ministry of Environment, were presented in a cabinet meeting regarding a nationwide ban on plantation permits in primary forests.2 Each map showed primary forests of different sizes and boundaries. Researchers attributed this information asymmetry to different forest classifications and mapping methodologies practiced by the two ministries.3 A scandal broke out, with environmentalists claiming that these discrepancies are an example of how corrupt officials manipulate maps and issue plantation permits on protected forest land.

Earlier in 1998, Indonesia’s timber and oil palm industry became increasingly decentralized and privatized.4 Over time, resource extraction became difficult to monitor, with central and provincial offices producing multiple, contradictory maps.5 Subsequent allegations of inaccurate maps and weak law enforcement by international aid donors and foreign governments led to broader uncertainties over forest stock. This deterred foreign investment into Indonesia’s emerging carbon reduction schemes—schemes that required new standards of transparency when estimating forest loss. One such scheme is the Reducing Emissions from Deforestation and Forest Degradation Plus (REDD+) program, a global climate initiative that treats forest carbon as a metric for financing a country’s performance in forest conservation.6 The promise that Indonesia’s export trade could be bolstered by new forms of climate finance renewed focus on the goal of transparency when mapping forest loss.

Under a 2016 Presidential Decree, Indonesia’s National Mapping Agency employed teams of earth scientists and geospatial data technicians to accelerate the remapping of Indonesia’s 18,309 islands. President Jokowi’s administration promulgated that a single base map would standardize how different ministries classified forest cover.7 The base map, conventionally understood as a “ground truth” to physical reality, was proposed as the solution to know where, for certain, forests have been cleared. Since 2016, state scientists have implemented a suite of artificial intelligence and remote sensors to expedite the remapping process. These new mapping technologies are aimed at removing human interpretation, with state scientists viewing the existing industry of geospatial data technicians as costly, inefficient, and vulnerable to bribes. At the core of this remapping effort, is the administration’s belief that maps should resemble territory.

Yet, senior bureaucrats of the National Mapping Agency have always been aware that maps could never represent the real world. The agency’s Deputy Director recently stated to the Indonesian press that data on palm oil plantation ownership is “secret.” Herein lies a tension between desires to conceal deforestation and the official appearance of attempts to reveal what’s happening on the ground. The accuracy of forest maps is not only due to technical expertise or the practice of transparency. A map’s legibility can also be understood as part of a measured and managed public revelation and the concurrent concealment of information, narratives, and images of the trees that still stand.

Michael Taussig, developing Elias Canetti’s dictum that secret is at the heart of power, argues that social orders are based on “public secrets”: forms of knowledge that are generally known insofar as they must not be overtly acknowledged.8 Simply put, one has to know what not to know. Public life, its discourse, and practice, then, depend upon the management of transgression.9 In Indonesia, it was understood that forest maps contained inaccuracies. From the fixed borders that enabled industrial plantation expansion to the inconsistent mapping standards, state maps were dissimilar all the way down. The recent remapping effort is an attempt at undoing such legacies, even when Indonesia’s state legitimacy in forest management relies on the maintenance of what is already known but cannot be said: no map resembles the world.

The pursuit of different versions of correspondence between territory and map segregates who gets to see and who gets to know what makes a forest. The labor of geospatial data technicians who are central to this operation to see—by constructing and calibrating base maps from satellite imagery, software, and in-person, in-the-field surveys—is likewise viewed as an obstacle to know a truly accurate map. Senior bureaucrats characterize data technicians labor as necessary, but likewise inefficient, a mere act of data collection, rather than trained expertise. Bureaucrats have advanced data science projects to automate the delineation of forest borders, to know the forest in precise ways that crowd out what for others is actually there.

Munir mapping a pixelated image in West Kalimantan.

Locating Boundaries in the Office and Field

The operation of correspondence practiced by data technicians was made clear to me when I was taught “how to see” at the technical office in Bandung. Working through a montage of green and brown, Munir commented: “When the brown pixel changes into a green pixel, what you see is the edge of a forest and the beginnings of a house. You try your best to draw a square, but always, a little forest or house will escape.” His earlier trace was returned in red, marked as incorrect by the National Mapping Agency. “They want us to draw every house, but I can hardly see them without zooming in. And if I zoom in, I will never finish this map in time. I will never be paid.”

Munir agonized over the deadlines set by the National Mapping Agency. He had spent hours determining what pixel makes the cut. Perhaps drawing in this green pixel matches the vegetation nearby; perhaps adding a brown pixel grants more property for the house owner. The blur in the images makes for a deliberation that also implicates his wrists and fingers that grow sore from his tactful eyes.10 At one point, I asked about the interstice where a green pixel had ended. Unsure, he hovered his mouse back-and-forth over the shades of green that rendered into a murky brown. Indeed, “there are no straight lines” on the edges of Kalimantan’s forest; someone feels these borders into vision.11 All the while, the technicians were reminded that an extra pixel adds at least five meters to the total calculated area, posing a serious challenge to Indonesia’s ministries in their bid to not misrepresent forest loss.

Data technicians on a German logging concession in Kalimantan.

In 2017, I followed Munir on a field survey to search for a GPS point plotted on a satellite image of West Kalimantan that had been taken earlier in 2015. Halfway into our journey into the thick of forest dew and sludge, Munir’s navigator stopped working. Local residents had earlier warned us that we were already trespassing into the concession areas of a German timber logging company and that we would be in grave danger if spotted. Munir refused to halt his search and return to camp. “I have to find this point. The Mapping Agency wants to know if this is a forest or a field. I don’t want to delay our team.”

To speed up these remapping activities, I later learn that Munir’s colleagues were instructed to classify forests using Light Detection and Ranging (LiDAR) data from the National Mapping Agency. LiDAR comprises three features: intensity values (i.e. the amount of light energy recorded), elevation values, and a return number (i.e. the total number of returns for a given laser pulse) recorded from a remote sensing device fitted to an airplane or satellite. These values are compiled into a 3D data “point cloud” that is unlike the pixelated image, emphasizing features that can’t be observed from plain sight.

Further contrasting the point-cloud to a pixel, an interlocutor at the National Mapping Agency told me that LiDAR can help technicians to think less and map faster. “Unlike a point-cloud, which intuition will tell you to join together based on the proximity of dots, a single pixel gives too much information. Pixels make an operator imagine, too much.” Munir’s supervisor confirmed this, commenting that technicians have “hands and eyes [that] are meant to work fast without thought.” Instead of drawing lines around pixels to classify building and property reserve, technicians now join proximate dots. A reprogramming of efficient minds is set in motion by points.

LiDAR point cloud of river and tropical forest in Kalimantan. The different colors represent the range of elevation values.

Deep Learning Ground Truth

Incremental efforts to limit technicians’ expertise extends to the application of deep learning techniques in state map-making contracts. Bayu, a university-educated earth scientist from the National Mapping Agency in Jakarta, has developed a method to transform a 3D LiDAR point cloud into 2D pixel-based images. These images are what Bayu then uses to train a fully convolutional network (FCN) to classify point clouds into different features (e.g. trees and buildings).12 Ironically, while technicians allegedly see too much in pixels, Bayu’s FCN model returns to pixels to categorize points. Extracted from LiDAR, these pixel images also act as the “ground-truth” for Bayu to calibrate future outputs from his model. Earth scientists like Bayu do not conduct field surveys to verify their maps. Verification involves comparing the model’s output to the ground-truth image, which is itself a derivative from the same output data, therefore producing what geographer Louise Amoore views as a model of what has become “normal” in the data.13

Bayu’s method of converting LiDAR points to pixels draws from Hu and Yuan’s (2016) point-to-image conversion.

Bayu’s model attempts to mimic how data technicians draw boundaries.14 Distinguishing ground from non-ground at the level of every pixel, his model is considered by his superiors as more precise than how technicians classify pixels. Absent from Bayu’s work, however, was a similar concern for the implications of correspondence. Unlike data technicians who deliberate on what pixels to include and exclude, and venture into the field to calibrate their judgement, Bayu felt alienated from his model’s decision. “It’s just a black box,” he told me.

Models that seek out patterns like Bayu’s deep learning technique resemble what computing scholar Dan McQuillan calls machinic neoplatonism.15 Neoplatonic approaches to science aim to reveal the “hidden mathematical order in the world” and go against experience.16 Bayu models what’s out there with traces of experience—the pixel—that can be quantified and computed in scales that exceed human apprehension. As critical data studies scholar Os Keyes claims, what differentiates traditional science and these data science examples is how the latter does not make theory.17 While the former attempts to explain truth by assuming a disinterested position, the latter arrives at truth without explanation. In Bayu’s case, a model is designed to be the optimal technician, yet it challenges what he could see and know. He can only verify the model’s output value against the “ground truth image”—nothing more, nothing less.

A roof surface comprised of LiDAR points with similar elevation values. Image credit to Bayu, National Mapping Agency, 2018.

During one workshop, Bayu realized that his FCN network had failed to classify features unique to Indonesia, in part owing to the model’s training data being generated from urban northern Europe. He attempted to add more object classes to the ground truth image. These included “Unclear Land” and “Waste,” categories informed by his living in Jakarta, a metropolis well-known to be heavily polluted. In its own way, I understood these revisions as resembling something of a field survey. Like Munir, stuck on the German-owned logging concession and committed to finding his GPS point, Bayu too was locating his own set of object classes to calibrate ground truth. Bayu’s computational practices, while different from a data technician’s tactful vision, is in every way iterative and experimental.

To date, the National Mapping Agency has resisted scaling up Bayu’s model to remap Indonesia. Senior bureaucrats claim that they do not know how it works. They compare the accuracy of Bayu’s model to the work of data technicians, arguing that his computational techniques cannot be accurate unless their outputs are verifiable in field surveys. Although often viewed as an exemplar to efficiently estimate forest loss, these algorithmic classifications were deemed inscrutable.

Cultivating a Willful Not Knowing

In the Indonesian state’s pursuit of a single map of the archipelago, the labor of data technicians is both displaced and venerated, albeit indirectly, in the reoccurring recognition of the need for field surveys to verify ground truth. When the administration of seeing the forest is enumerated into wage labor, state agencies regard the technician’s work as too inefficient, documented by their seeing too much. Data science initiatives, on the other hand, draw borders without explanation to remove this interpretive labor. In opposition to the less educated, lower-class data technicians, this work resembles a “tiered” seeing, to borrow from feminist technoscience scholar Mitali Thakor where “certain perceptions are afforded higher authority.”18 Trained to recognize points instead of pixels, Bayu’s model privileges a specific mode of knowing that is preemptive, even if experiential by design. Points are converted into labeled pixels and fed into models that in turn label points anew: points feed points. Unlike the field survey, with data science, ground truth is found within the image, not in the forest.

Indonesia’s forests are seen and known by different techniques. These techniques either institute or automate proxies of human interpretation in the pursuit of ground truth, and aim to resolve a crisis of legitimacy in forest management. Yet in keeping with the public secret of how forests are seen and governed by the state, each of these techniques also cultivates a willful not knowing. Against the backdrop of the decades-long expropriation of indigenous land by patronage networks between timber and palm oil firms and central and district officials, broader shifts to institute efficiency and automation in mapping enable bureaucrats to relinquish their knowledge of such inconvenient truths.19 These technical initiatives recast the mapping of Indonesia as a preemptive activity, rather than a product of trained expertise. The task of knowing what not to know emerges not only from the discursive theater of public human affairs, but out of the contest between the design and deployment of various mapping systems, field surveys, and data architectures.

Who’s Watching When a Tree Falls?

Is it possible to capture the world without seeing it? Or, who’s watching when a tree falls? Perhaps it doesn’t matter who, but how that watching is designed into a system that preempts a forest without contact, without encounter. Its every leaf and branch, processed into data points, is submitted to a regime of inescapable visibility.20

Yet Indonesia’s forest can also be read through an intimacy of co-presence, like what has been observed by anthropologist Juno Salazar Parreñas in her work with indigenous Iban rehabilitation workers and displaced orangutans in Malaysian Borneo.21 This intimacy is beset with contradictions and uncertainty: caretakers keep a distance from orangutans so that they learn how to survive in the wild, yet remain close to continue their care for them, often at the expense of potential injury. Against the “shared interface of displacement,” where indigenous Iban workers and orangutans are dually displaced by resource exploitation and internal colonialism, this co-presence entails a “mutual vulnerability” and interdependency.22 Even if such relations remain brief and uneven for those involved, it is in co-presence that a diversity of life can be understood.

When technicians shape and hold together pixels and points, squares and rectangles, folder structures and files, they engage in a co-presence with what’s mediated. When looking for points in troubled terrain, technicians offer a chance of encounter to themselves and their superiors, even as this work remains tied to wage labor and practical pursuits. In muted ways, technicians intervene in the preemptive nature of algorithmic classification. Their staring at screens is not a passive pause, but an active restraint and deliberation on the conditions of inclusion.

Notes
1

Suzanne Moon, “Takeoff or self-sufficiency? Ideologies of development in Indonesia, 1957-1961,” Technology and Culture 39, no. 2 (1998): 187º212; Eunike Gloria Setiadarma, “Cultivating Pembangunan: Rice and the Intellectual History of Agricultural Development in Indonesia, 1945-65,” (2019), .

2

Since 2015, both ministries have merged to form the Ministry of Environment and Forestry.

3

Rini Astuti and Andrew McGregor, “Responding to the green economy: how REDD+ and the One Map Initiative are transforming forest governance in Indonesia,” Third World Quarterly 36, no. 12 (2015): 2273–2293; Nabiha Shahib, “Indonesia: one map policy.” Open Government Partnership (2016).

4

It has been argued that this restructure enabled district mayors and village leaders, backed by political elites in the Ministry of Forestry, to finance their budgets by faking or fixing permits for resource companies. See Anna Lowenhaupt Tsing, Friction: An Ethnography of Global Connection (Princeton University Press, 2005); Tania Murray Li, The Will to Improve: Governmentality, Development, and the Practice of Politics (Duke University Press, 2007); Nancy Lee Peluso, “Whose woods are these? Counter‐mapping forest territories in Kalimantan, Indonesia,” Antipode 27, no. 4 (1995): 383–406.

5

Rini Yuni Astuti, REDD+ Governmentality: Governing Forest, Land, and Forest Peoples in Indonesia, Victoria University of Wellington, PhD Dissertation (2016).

6

Ibid.

7

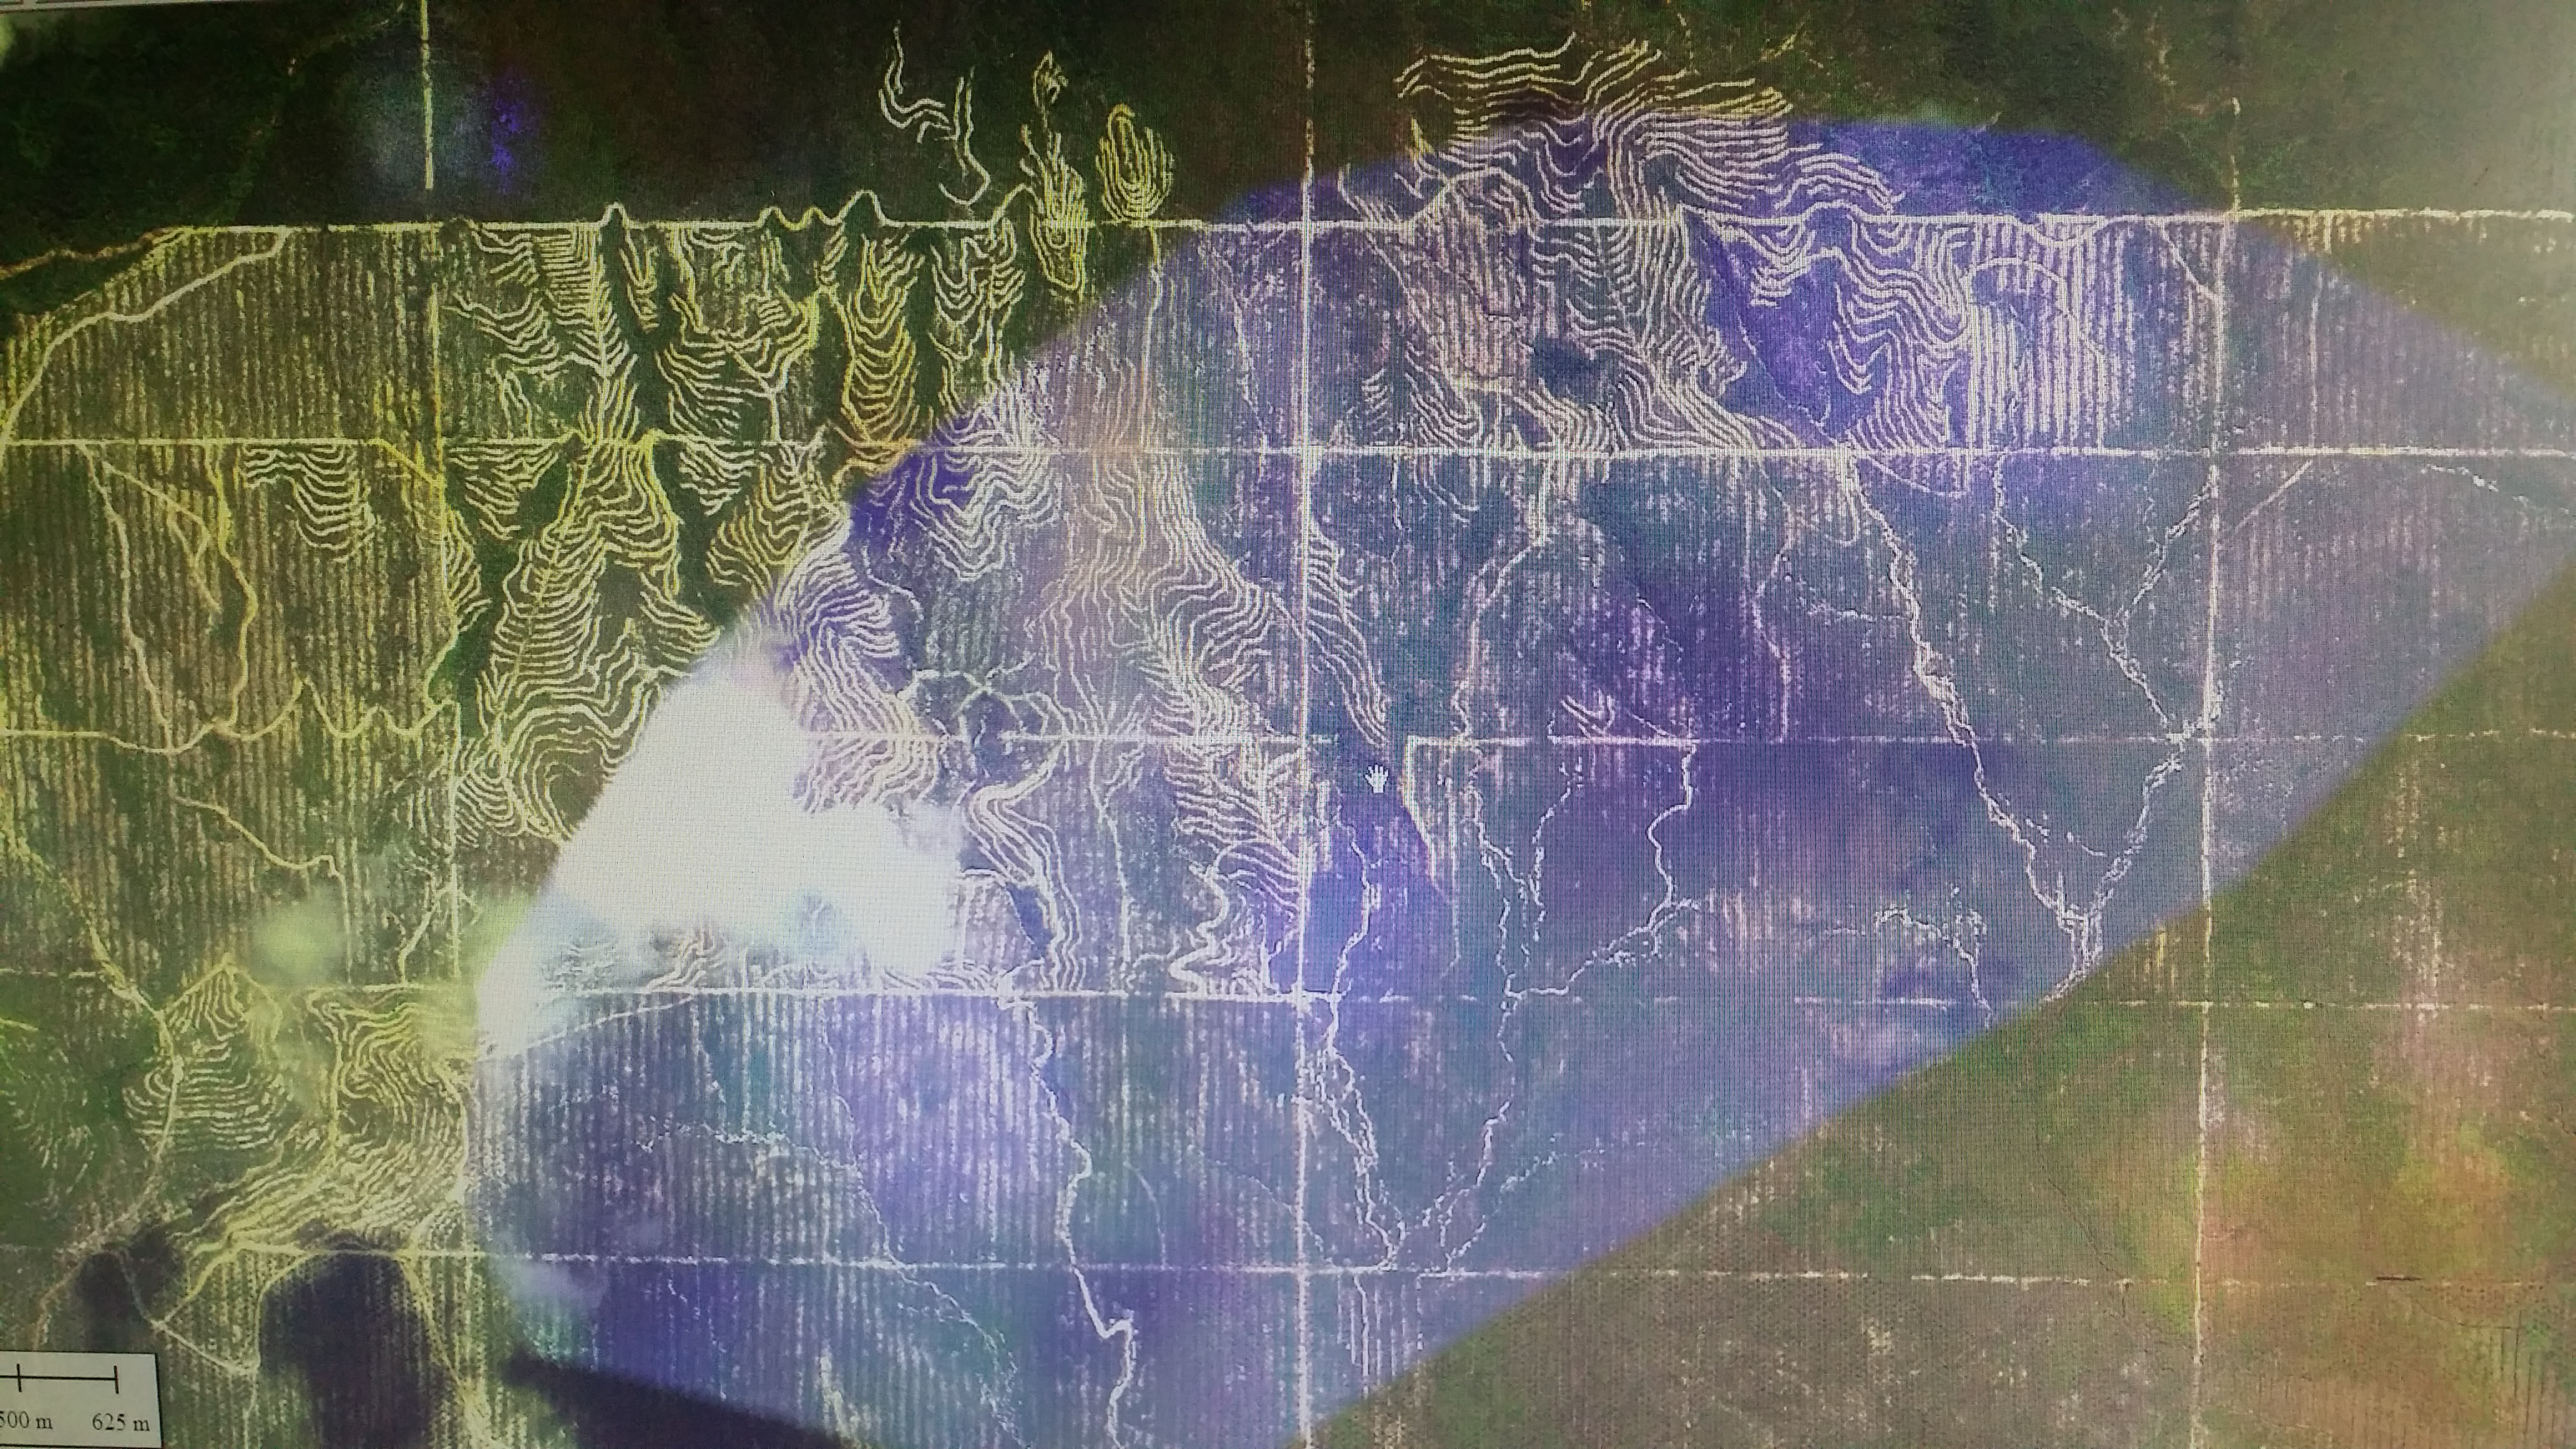
A base map is a layer with geographic information that serves as a background setting for other maps. It establishes the geometrical and orientation reference for the viewer of a thematic map.

8

Elias Canetti, Crowds and Power (Macmillan, 1984: 290); Michael Taussig. Defacement: Public Secrecy and the Labor of the Negative (Stanford University Press, 1999).

9

Raminder Kaur and William Mazzarella, eds., Censorship in South Asia: Cultural regulation from sedition to seduction (Indiana University Press, 2009).

10

Eva Hayward, “Fingeryeyes: impressions of cup corals,” Cultural Anthropology 25, no. 4 (2010): 582.

11

Sophie Chao, “There Are No Straight Lines in Nature: Making Living Maps in West Papua,” Anthropology Now 9, no. 1 (2017): 16–33; Jennifer Fisher, “Relational Sense: Towards a Haptic Aesthetics,” Parachute: Contemporary Arts Magazine 1 (1997); Andrea Ballestero. “Touching with Light, or, How Texture Recasts the Sensing of Underground Water,” Science, Technology, & Human Values 44, no. 5 (2019): 762–785.

12

Bayu discussed with me how he trained his FCN model and developed a ground truth image: First, superimpose a 1 by 1-meter pixel grid on to a LiDAR point cloud. The grid is meant to represent a pixel-based image. There will likely be more than one LiDAR point within a pixel. Second, in each pixel of the grid, choose the LiDAR point with the lowest value. Each LiDAR point contains a value calculated from (1) elevation; (2) intensity; (3) return number; and (4) height difference i.e. the difference in elevation between a LiDAR point and neighboring points. It is assumed that LiDAR points with higher values will represent non-ground features such as vegetation and building. Third, tag the pixels containing low values as ground. Points that exceed the threshold of 15cm are labeled as non-ground points. The final tagged image is called the ground truth image. Fourth, create the training dataset using an unlabeled image extracted from LiDAR point cloud (from steps 1 and 2). Fifth, train a fully convolutional network (FCN) with dataset. Sixth, the output of the FCN is a predicted label for each pixel. Seventh, compare the output to the ground truth image. If the predicted labels (“ground” and “non-ground”) are different from the ground truth image, change the weights and parameters in the FCN model until the output’s labels correspond to the ground truth image. Eighth, transfer the predicted label of each pixel back to the original LiDAR point cloud. Ninth, repeat steps two and three to create an image of non-ground points derived from selecting the highest values. Separate non-ground points into finer classes: vegetation and building. Building and vegetation labels are created based on three assumptions: (1) A building’s roof surface is comprised of LiDAR points with similar elevation values; (2) A building’s edges do not have neighboring points on all of its sides; (3) the intensity value of vegetation is lower than that of buildings. Building and vegetation labels are transferred to non-ground points from the result of the ground classification derived in step three.

13

Louise Amoore, “Doubt and the Algorithm: On the Partial Accounts of Machine Learning,” Theory, Culture & Society 36, no. 6 (2019): 147–169.

14

Xiangyun Hu and Yi Yuan, “Deep-learning-based classification for DTM extraction from ALS point cloud,” Remote Sensing 8, no. 9 (2016): 730.

15

Dan McQuillan. “Data Science as Machinic Neoplatonism,” Philosophy & Technology 31, no. 2 (2018): 253–272.

16

Ibid, 261.

17

Os Keyes. “The Gardener’s Vision of Data,” Real Life, May 6, 2019, .

18

Mitali Thakor, “Digital Apprehensions: Policing, Child Pornography, and the Algorithmic Management of Innocence,” Catalyst: Feminism, Theory, Technoscience 4, no. 1 (2018): 8.

19

Helena Varkkey, “Patronage Politics as a Driver of Economic Regionalization: The Indonesian oil palm sector and transboundary haze,” Asia Pacific Viewpoint 53, no. 3 (2012): 314–329.

20

Work on “inescapable visibility” and “hypervisibility” comes from a long tradition of Black feminist scholarship on the representation of Black lives, visibility politics, and surveillance. See for instance, important work written by scholars Simone Browne, Dark Matters: On the Surveillance of Blackness (Duke University Press, 2015); Nicole R. Fleetwood, Troubling Vision: Performance, Visuality, and Blackness (University of Chicago Press, 2011); Hortense J. Spillers, “Mama’s baby, papa’s maybe: An American grammar book,” diacritics 17, no. 2 (1987): 65-81; Audre Lorde, Sister Outsider: Essays and Speeches (Crossing Press, 2012 {1984}).

21

Juno Salazar Parreñas, Decolonizing Extinction: The Work of Care in Orangutan Rehabilitation. (Duke University Press, 2018).

22

Ibid, 68–71, 121.

At The Border is a collaboration between A/D/O and e-flux Architecture within the context of its 2019/2020 Research Program.

Category
Land & territory, Data & Information
Subject
Maps, Southeast Asia, Plants & Forests, Extractivism
Return to At The Border

This essay documents field research conducted between 2016 to 2018 in Indonesia. The author would like to thank Lisa Nakamura, Juno Salazar Parreñas, Sareeta Amrute, Silvia Lindtner, and Andrew Moon for their careful reading, generous support, and wit. This piece has been many years in the making since it was first presented for a panel on Platform Practices and Predictive Seeing organized by Adrian Mackenzie and Anna Munster at 2018 annual meeting of the Society for Social Studies of Science (4S) and subsequently, for a panel on Artifice Intelligence: Fabrication, Fakery, and the Virtually Human organized by Beth Semel and Mitali Thakor at the Annual Meeting of the American Anthropological Association in 2018. The author would also like to thank Adrian Mackenzie, Beth Semel, and Mitali Thakor for their very helpful feedback during these panels and outside of them. Finally, this piece wouldn’t have been possible without the data technicians and scientists who kindly shared their drawings, surveys, and musing.

At The Border is a collaboration between A/D/O and e-flux Architecture within the context of its 2019/2020 Research Program.

Cindy Lin is a PhD candidate in the School of Information and the Science, Technology, and Society program at the University of Michigan, Ann Arbor. She is currently engaged in long term dissertation fieldwork with state science agencies and global tech corporations that are developing techniques to address peatland fires.

Advertisement
Subscribe

e-flux announcements are emailed press releases for art exhibitions from all over the world.

Agenda delivers news from galleries, art spaces, and publications, while Criticism publishes reviews of exhibitions and books.

Architecture announcements cover current architecture and design projects, symposia, exhibitions, and publications from all over the world.

Film announcements are newsletters about screenings, film festivals, and exhibitions of moving image.

Education announces academic employment opportunities, calls for applications, symposia, publications, exhibitions, and educational programs.

Sign up to receive information about events organized by e-flux at e-flux Screening Room, Bar Laika, or elsewhere.

I have read e-flux’s privacy policy and agree that e-flux may send me announcements to the email address entered above and that my data will be processed for this purpose in accordance with e-flux’s privacy policy*

Thank you for your interest in e-flux. Check your inbox to confirm your subscription.