Software as Infrastructure - Amelyn Ng - 7D Vision

7D Vision

Amelyn Ng

“MEP” view of Bryden Wood’s BIM model of Gatwick South Terminal Pier 1, completed from 2012 to 2016.

Software as Infrastructure
August 2020

On the surface, the way we document buildings may still look the same. Modeling software, like any other tool in history, helps architects depict, design, and produce drawings for construction. But something has fundamentally changed in the ambitions of architectural visualization, and with it, relationships between representation and reality. Digital information has never been more closely coupled with the material logics and deployable flows of construction and operations across a building’s life.

In the last two decades, Building Information Modeling (BIM) has emerged as a de facto industrial-strength medium of the global Architectural, Engineering, and Construction (AEC) industry. BIM takes on an increasingly credible vision in search of greater construction efficiencies, error reductions, labor savings, and other frontiers of optimization. New modes of representation have emerged to support ever tighter synchronizations of building information, across ever larger surface areas of spatial management. Bigness meets “BIMness.”1

BIM “7D” graph, from Cameron Richard, “7D 6D 5D 4D 3D bIM Dimensions bIM Services ESTIMATING,” found on Slideplayer.

Today, BIM is regarded to be on the same digitally “disruptive” plane as big data, robotics, and Virtual/Augmented Realities (VR and AR).2 Beyond 3D modeling, it has acquired a worldview of no less than seven dimensions: a 4D model simulates construction time; 5D estimates building cost; 6D analyzes energy and sustainability outcomes; and 7D manages facilities using a model of the building as-built.3 While 7D applications are still far from achieving the ubiquity that 3D BIM software currently enjoys, architecture’s “information turn” spells a new paradigm for cataloging the built environment as a single database of linked object data, from the scale of a wall or door element to (ostensibly) a building’s entire operational life.

This warrants a materialist understanding of “architectural visualization”—one that is not reduced to an affective or rhetorical function, as is the case with renderings and other architectural eye-candy. Rather, “visualization” compounds information (visual and nonvisual) in an “optically consistent space” for the calculated coordination of an entire industry. Modeling software is a “‘universal exchanger’ that allows work to be planned, dispatched, realized, and responsibility to be attributed.”4 Such an optical instrument manages material facts, secures expertise, and orders realities. Visualization is therefore bound up with the apparatus of vision itself—how one sees makes possible what one sees, which makes possible what one plans to do.5 Unlike a rendering, the technical image is not a suggestive picture, but a proxy. Its graphics are not relevant for their symbolic qualities, but for their sociotechnical dispositions. What does “7D” allow us to see (and do)? What human-machine relations and coordinated worlds are brokered by software?6

Example of a BIM model from Google image search. From J.J. Tang/HDR.

Google “Building Information Model,” and you will find two distinct visual conditions: either ultrageneric solid building mass, economically cast in some default grey Shaded View on a WYSIWIG interface;7 or fluorescent pink, yellow, and acid green MEP and other engineering elements, densely compacted into a barely-there building envelope.8 If the first conveys self-evidence and cost reliability, the second conveys coordination expertise. This dichotomy points to a BIM model’s graphically split personality—an AEC Jekyll and Hyde.

Reyner Banham once described the High Tech impulse as “the most recent way of bringing advanced engineering within the discipline of architecture.”9 BIM visuality exemplifies this union. At first, building information guts appear no differently to the 1960s/1970s proclivity for seeing pipes before architecture, or pipes-as-architecture.10 One is reminded of François Dallegret’s canonical Anatomy of a Dwelling, which illustrated Banham’s “baroque ensemble of domestic gadgets.”11 But BIM’s lurid ducts depart from the High Tech milieu of tubular exuberance. Unlike Dallagret’s ornamental compositions, today’s labyrinthian HVAC layouts are militantly coordinated ensembles, demonstrating an ability to work-as-modeled.

Unlike the iconographic Centre Pompidou, whose exposed services are didactically denoted (general blue for air-conditioning, yellow for circulating electricity, and so on), BIM color-codes act more as durable office standards, disciplining screen vision across space and time, projects, workers and departments.12 For example, according to GSA BIM standards, the blue used for Compressed Air (RGB 0, 0, 255) is numerically distinguished from Domestic Cold Water (RGB 0, 63, 255), even though they look almost exactly the same.13 BIM’s pedantic chromatic spectrum hints at the sheer density of consultant information entering the singular scene of the model to the point where colors are not optically but numerically verified.

Lawrence G. Roberts, Perspective view in Sketchpad. From Ivan E. Sutherland, “Computer Inputs and Outputs,” Scientific American 215, no. 3 (1966): 96.

Even though they are not photorealistic, BIM graphics are somehow deeply trustworthy: the building looks overwhelmingly buildable. The use of screenshots on AEC company websites to convey BIM services to a non-technical audience may contribute to this solvency. A champion of the paperless domain, screenshots mark an epistemological shift from human-checked printed documents toward that of a “virtually witnessed” reality.14 Developed by the CAD Project at MIT in the 1960s, screenshots established visual conventions to show a computer-oblivious public that human-machine interactivity existed.15 According to Matthew Allen, “Computer-aided design and the interactive computer needed a public relations campaign in 1960 because their novelty was easy to miss.”16 17 The screenshot thus contributed to the historical development of computer coordination as proof of professional expertise and to the cultivation of confidence in interactive machine intelligence.18

Screenshots of space planning from the IMAGE interface, 1975. Shown is a MIT student project (above) and hypothetical design proposal based on a problem used in a US Army Corps of Engineers study (below). From Guy Weinzapfel, “Following the Yellow Brick Road,” in Reflections on Computer Aids to Design and Architecture, ed. Nicholas Negroponte (Petrocelli/Charter: New York, 1975), 97.

Screenshots would later record (self-)evidence of computer-generated space planning. Used to assess architectural program layouts in the 1980s, MIT’s experimental IMAGE interface was “an interactive graphics-based computer system for multi-constrained spatial synthesis.”19 IMAGE’s parameter-based space ranking and evaluation routines were tested in several “real-world” settings: MIT’s planning office, an architectural office, and in the studio classroom. A study was also conducted for the US Army Corps of Engineers, where IMAGE was used to analyze the hypothetical design of a recreation center for planning inconsistencies. While in no way claiming to generate total spatial solutions, IMAGE “provided quick, inexpensive, and wholly accountable evaluations of submitted design proposals” and was regarded as “a tool capable of helping designers to converge on design solutions.”20 The study concluded that IMAGE was, indeed, “helpful in the development of an architectural space program” and “could play several useful roles for agencies that monitor large numbers of building design contracts.”21 Machine-responsible space planning would later become integrated into smart modeling practices to the point where, today, entire rooms are parametrically guaranteed.22

A sample of the UK Ministry of Justice’s BIM prison room objects. The MoJ has been actively digitalizing their penal estate over the last five years, working on a comprehensive BIM library of carceral assets. Presentation slide prepared by Bryden Wood Technology and the Center for Digital Built Britain. From Jaimie Johnston (BIM Task Group, Delivery & Productivity), “Process mapping—Ministry of Justice,” March 17, 2016, 34.

From analysis to application, digitalized space planning routines have become extremely efficient for Foucauldian typologies like operating theaters and prison cells, with highly prescriptive design briefs, predictable layouts and replicable object sets.23

James Gowan’s Housing at East Hanningfield: Section through house with mechanical services, 1975–1976, color print. From the Drawing Matter Archives.

Depiction, Detection, Simulation

In strictly 2D drawings, building elements are geometrically translated and pictorially ordered into legible relationships. Drawn around the time that the Centre Pompidou were being constructed, a drawing from James Gowan’s 1975 Housing at East Hanningfield shows a pictorial composition of pipes and trusses, hand-drawn and color-coded for presentation.24 Even pre-CAD, the drawing reads startlingly like BIM: the solid building recedes, foregrounding a suspended architecture of object-oriented services. But unlike BIM, these objects are inert.25

In the same year, Charles Eastman, software developer/architect/putative “father of BIM” proposed that 3D elements could be cataloged and coordinated in precise alphanumeric (i.e. machine-readable) terms, which when assembled together in a relational model, would eliminate the repetitive labor of updating 2D drawings, and facilitate “any type of quantitative analysis.26 In 1986, software developer Robert Aish (now at Autodesk) published a seminal paper on the first proto-BIM model RUCAPS, which built on this newfound agency for building modeling.27 No longer just representational plots of data, digital models could be sufficiently imbued with “compatible, if not synonymous” descriptions to become motivated inspectors of that data.28

“Using 3D visualisation to identify clash detection between services and structure in a plant room.” From Robert Aish, “Building Modelling: The Key to Integrated Construction CAD,” in CIB 5th International Symposium on the Use of Computers for Environmental Engineering Related to Buildings, Bath (July 1986), 64.

As Eastman portended, drawings could now reliably read and redraw each other from a master model: moving a window or a desk in plan would cause other sections, elevations, and perspective views to be regenerated accordingly.29 The model was now able to coordinate itself. Yet the ability for models to identify its own clashes and become comprehensive object databases was related to improved computer processing and storage hardware. Machine coordination has a material base—acknowledged almost half a century ago, as an impediment.30

Combing through a BIM model, the machine-eye of coordination software flags discrepancies for us.31 Compare Gowan’s East Hanningfield section with recent screenshots of an automated clash detection routine, featured on the website of Arkansas contractor Nabholz Corporation under “The Beauty of BIM.”32 While Gowan’s drawing looks technical (a depiction), Nabholz’s images enact the technical (a calculus).33 The model coordinator shifts from a human position outside the model (like a doctor interpreting an x-ray, or an architect reading a drawing), to a point-of-view inside the model (like a camera probe for internal examination).34

Yet Nabholz’s images are not being used for technical calculation. As Vladimir Bazjanac observed in 1975, at the early implementation of computer-aided architectural simulation: “What [architects and clients] expected from a computer model was credibility, not precision.”35 The business of BIM software thrives on clashes, and their detection, between different documents and models. The sales model of collaborative platforms—surely, the very act of coordination—cannot exist without the visualization of conflicting information.

Still from Synchro Software, “4D BIM/VDC Construction Project Management,” YouTube, October 30, 2016.

Today, the invisible hand of building coordination extends beyond 3D. In a 1982 drawing of the Patera prefabricated building system by Hopkins Architects (another High-Tech protagonist), a yellow crane symbolizes the phase and nature of site labor. In a 2016 video advertisement by Synchro, a 4D construction management software company, however, the crane simulates project-specific site activity in fast-forward video sequence.36 The primary source of detail is no longer in the drawing, but the corpus of a database from which objects, drawings, reports, timelines, and virtual experiences are retrieved and regenerated.

While drawings express physical labor, clash reports and time simulations tell us how the machine saves humans from it (or so the refrain goes).37 Over the last century of innovations in industrial mechanization—from the Newcomen steam engine to the Frankfurt Kitchen and the Amazon Mechanical Turk—automation under capitalism never quite plays out for the worker in the end.38 Such a paradox of labor even exists in computer graphics: Blinn’s Law states that even as “technology advances, render processing time remains constant.” 3D animators tend to respond to reduced hardware barriers by making more computationally demanding simulations, rather than rendering the same scenes more quickly.39

For now, the clash detection feature starring in Nabholz’s reputational images does seem to indeed be time-saving. But such software advancements necessitate an expanded skillset of human-machine partnerships, which require of its users even more kinds of checking activity, before, with, and behind the machine.40 “Human error” has not gone away, and no matter how reliable the automaton, fears of impending financial and legal liability are felt by its ever-conscientious operators.41

BIMobject library search for “pipe.”

Objecthood

René Magritte once admitted to the indexical limits of the image: Ceci n’est pas une pipe. The treacherous pipe paradigm has held more or less true through 2D and 3D architectural drawing and modeling: the image is no substitute for the real. That was only true until simulation became a possibility. In Autodesk Revit, a pipe can be expected to perform engineering analysis and optimize fluid flows. Pipe Types now submit to “real-world systems” such as gravity and pressure.42 Far more than just “a” pipe, today’s parametric pipe is uniquely identified: Logiwaste_DN 400 Pipe_4311-15-TT021SS.rfa.43

Pipes aside, a surfeit of exacting construction materials, calculated structural elements, product-specific appliances, and engineered finishes are parametrically available and awaiting architectural specification—even clear primer, an invisible undercoat material, can be accurately applied to your model.44 Smart coordination turns architectural “space” into discrete, clickable assets guaranteed of a supplier. All across the BIM object-world, generic representations give way to proxies—offering ever greater coordination between the virtual and the real.

With great object specification comes great responsibility for its storage. Just as new archival practices arose over the nineteenth century to meet the eruption of photographs, data spreadsheets, object libraries, and clash reports register archive anxieties surrounding the mass proliferation of building data.45 Along with this comes, of course, liabilities, intellectual properties, and desires to control data stock. Today, virtual components are pre-approved and stockpiled in 3D warehouses on cloud or server, readily deployable for any project. Global offices like Arup have amassed in-house inventories of over 25,000 intelligent BIM objects for their engineering and architecture projects.46

Miele Residential Revit content library, 2016. From Bimhub.

Software platforms are new keepers of the trade library. Even Trimble—owner of the much-maligned free modeling software, SketchUp—now offers Trimble MEP and “one stop shop” BIM content management platforms boasting eight million components.47 Object properties become object property. From Duravit sinks to Miele dishwashers, many major manufacturers now provide comprehensive BIM objects for entire product ranges. As architects gravitate toward clean, correct componentry for model fidelity, the menu variety and quality of virtual objects influence which supplier gets the job.

As BIMObject, BIMSmith, RevitCity and other trade platforms gain currency, smaller players lacking BIM expertise or overheads to invest in the virtual object economy may consequently be disadvantaged in the real supply chain.48

“All Furniture Blocks Bundle(Recommanded!!)” from Allcadblocks.com. Restricted to plan, elevation or section, such CAD blocks are considered “dumb graphics” by the parametric elite.

Information Rich and Poor

Coordination is not without class distinction: namely, “smart” versus “dumb” computer graphics.49 Hito Steyerl once described and defended the “poor image”: ragged and ripped digital artifacts which pervade the web as “lumpen proletarian,” in contrast to their elite high-resolution counterparts.50 If smart graphics in today’s architectural software means parametric, product-specific, and behaviorally-accurate models, dumb graphics refer to uncoordinated 2D CAD blocks, generic furniture models, and error-prone free warehouse downloads. Unable to simulate anything but nevertheless circulate widely and stashed like ammunition on office servers and student hard-drives alike, such graphical detritus—architecture’s poor image—escape total management.

Through the eyes of the Smart City, the classist smart/dumb divide maps onto actual things: smart (sensor-laden) versus dumb (sensorless). According to one internet-of-things hardware provider: “Without a means to sense, capture, process, and send [collected] information, most of these objects remain dumb objects.”51 Sensorless stuff tends to elude software’s committed grip at the cost of participation. Will “dumb” devices one day be illegible to the smart city model? Among the potentially digitally endangered: non-compliant materials, obsolete appliances, broken (object) Families…52 As digital models gradually become proxies for real building conditions, would the “poor” building image cease to be insurance-claimable, to be recognized as valid entities deserving of servicing or services?53

Autodesk BIM360 Ops for mobile devices. Images from Apple App Store Preview.

Interface

At the 7D scale, model coordination occurs long after the building is built. The BIM model, in all its exploitable data-richness, is tooled into facility management software. With EcoDomus, for example, building managers wield “assets in 3D to track mechanical, electrical, plumbing systems and identify areas of concern, i.e. plumbing leaks.”54 In SpaceIQ Personnel & Occupancy, one can interact with rooms in a “live” building plan for occupancy status updates, providing “improved reporting on employee headcounts and locations, average room areas, room availability, space benchmarking, [and] occupancy rates.”55

Lifecycle coordination invites a diverse array of interfaces: from diagrammatic dashboards to model views which lets managers see through walls into substructure, to geomapped point-cloud interiors with RPG-style navigation, to “Enterprise Information Modeling,” which combines BIM, geospatial, human resources, and financial data for a “[full life-cycle] view of an organization and its processes”—from a pipe to a property portfolio.56 In this entrepreneurial world-view, everything is an asset. The denser the information, the greater the potential Return on Investment (ROI).57

Gamma AR Augmented reality software on mobile devices for construction sites.

Technicolor coordination extends beyond the screen, overflowing onto building sites and operational facilities. Contractors, clients, consultants, building managers, and maintenance workers may be goggled and gazing up at AR-projected duct layouts, or waving smartphones around building sites to identify variously hidden MEP elements.58 In Autodesk’s mobile facilities asset management software, BIM 360 Ops, building models are highly specified and rendered in site-specific, navigable, and portable detail.59 The building model can now provide preventative maintenance, prompting the replacement or repair of worn parts before systems fail.

These management systems make the upkeep of building infrastructure appear effortless—occupants may never have to see a light being replaced or elevator being fixed. The goal of 7D, it seems, is to wrest the data-rich model into an “electronic owner’s manual.”60 The energies poured into modeling a world in such precise, determinant terms bend in service of remote asset governance.

“Digital Twin” stills from a promotional video by DNV GL, a Norwegian quality assurance and risk management company, whose mandate is “Building the invisible infrastructure of trust.” DNV GL recently presented the concept of “Probabilistic Digital Twins” at Offshore Europe 2019, for live asset risk assessment of oil and gas infrastructures.

As the drive to integrate units of information at ever greater speeds of life-cycle synchronization, technical precision is increasingly equated with fact. The cybernetic building of material facts, inside and outside the computer, can be summed up in emerging technologies like the “digital twin.” Defined by IBM as a “dynamic, virtual model of the physical structure, powered by the massive amounts of [sensor] data that a single structure generates around the clock,” the digital twin is used to “offload some of the tedium of facility management” by automatically ordering replacement parts, regulating maintenance, switching devices on/off according to building occupation levels, and other efficiency-boosting feedback operations.61 Originally conceived for digital factories, digital twins now remotely manage offshore oil rigs, wind farms, and other extra-large infrastructures.62

“Digital Twin” stills from a promotional video by DNV GL.

The digital twin of Amsterdam’s Schiphol Airport links BIM and GIS to real-time incident data, and can simulate “potential operational failures throughout the entire complex, which saves us both time and money.”63 The model is now a virtual replica of reality that tests for future scenarios, and readjusts. The recursive feedback loop so familiar to cybernetics theory today approaches a “constant vigilance.”64 The observant, self-regulating system is advocated as a means of predictively managing aging assets, or conversely, accelerating profit gains.65

In Rated Agency, Michel Feher posits that today’s investments are secured by demonstrating creditworthiness, be it though “resources, a reputable record, or wise projects.”66 Building simulations carry reputational value and investment-worthiness, choreograph vision and labor, and guarantee an error-free reality. No longer just envisioning-instruments, software becomes a new data-rich site for owning, issuing, predicting, and verifying claims about infrastructure.

7D vision points to a larger logistical apparatus. Architectural visualization is no longer about building form per se, but about forms of building information and their management. Drawings now draw as many things as possible together so as to harness them at every turn in a building’s life.67 As the building information model becomes a new locus of power and prophecy, how that power is enacted becomes just as much a question of politics as it is of visuality.

Notes
1

This is a borrowed alliteration. See Jeffrey Inaba and Benedict Clouette with C-Lab, “BIMness: or, The problem of integration,” in Rem Koolhaas, Elements of Architecture (Cologne: Taschen, 2018), 370–375.

2

According to the World Economic Forum, digital technologies “including building information modeling (BIM), prefabrication, wireless sensors, 3D printing and automated and robotic equipment, are affecting the entire industry,” “gradually changing how infrastructure, real estate and other built assets are designed, constructed, operated and maintained.” See Michael Buehler et al., “The Fourth Industrial Revolution is about to hit the construction industry. Here’s how it can thrive,” World Economic Forum, June 13, 2018, ; in more detail, World Economic Forum and the Boston Consulting Group, “An Action Plan to Accelerate Building Information Modeling (BIM) Adoption,” World Economic Forum, February 2018, .

3

The 4D, 5D, 6D and 7D mentioned in this essay are (regrettably) not to be confused with the multi-dimensioned mechatronic theme park entertainment simulators from the early 2000s. See “BIM dimensions—3D, 4D, 5D, 6D, 7D BIM explained,” BibLus-ACCA software, April 18, 2018, ; “What is BIM?,” Autodesk, . “As the successor to traditional computer-aided design (3D CAD), BIM stores and provides 3D object data. It also can include shared information on scheduling (4D), cost (5D), sustainability (6D) and operations and maintenance (O&M) (7D).” See World Economic Forum, “An Action Plan to Accelerate Building Information Modeling (BIM) Adoption”; Rajat Agarwal et al., “Imagining construction’s digital future,” McKinsey & Company, June 2016, . For screenshot examples of each “dimension”, see “BIM Services,” Virtual Building Studio, .

4

Bruno Latour’s remarks on the technical innovation of engineering drawings in “Visualisation and Cognition,” I argue, could well apply to BIM models. “Industrial drawing not only creates a paper world that can be manipulated as if in three dimensions. It also creates a common place for many other inscriptions to come together…Realms of reality that seem far apart…are inches apart, once flattened out onto the same surface. The accumulation of drawings in an optically consistent space is, once again, the ‘universal exchanger’ that allows work to be planned, dispatched, realized, and responsibility to be attributed.” Similarly, BIM gathers together a multitude of numbers, reports and material facts about a building project into a central information database, so that many eyes and hands can act on the same “reality” with ease and precision. See Bruno Latour, “Visualisation and cognition: Drawing things together,” in Knowledge and Society Studies in the Sociology of Culture Past and Present 6 (1986): 26. Emphases added.

5

“A new visual culture redefines both what it is to see, and what there is to see.” Ibid.

6

After Latour, Reinhold Martin also calls for a materialist definition of architectural visualization when approaching digital modeling. “So rather than asking ‘What does this drawing mean?’ or ‘What future building does it represent?’ we might ask, ‘What commands does it issue, what does it make possible, what materials does it assemble, what objects or processes does it organize?’” See Reinhold Martin, “Points of Departure: Notes Toward a Reversible History of Architectural Visualization,” in The Active Image: Architecture and Engineering in the Age of Modeling, eds. Sabine Ammon and Remei Capdevila-Wering (Cham: Springer Verlag, 2017), 3.

7

This is why architects everywhere decry BIM as the bane of professional life.

8

MEP stands for Mechanical, Electrical, and Plumbing engineering services. At its broadest, this triumvirate of technical disciplines makes building interiors suitable for occupancy. In the UK and Australia, it is also known as architectural engineering, or building services engineering.

9

Todd Gannon, Reyner Banham and the Paradoxes of High Tech (Los Angeles: The Getty Research Centre, 2017), 244.

10

Banham famously ruminated on pipes-as-architecture; see Reyner Banham, The Architecture of the Well-Tempered Environment (London: Architectural Press, 1969). They remained a fascination for decades, for example in the Volume 37 (November 2013) issue, “Is This Not a Pipe?”.

11

See Reyner Banham, “A Home is not a House,” Art in America 53, no. 2 (April 1965): 70–79.

12

On algorithmic color, Carolyn Kane posits: “Whether optical or algorithmic, color is not exclusively about vision. Rather, it is a system of control used to manage and discipline perception and thus reality…beyond any single viewer, physical technology, or image-artifact.” Carolyn L. Kane, Chromatic Algorithms: Synthetic Color, Computer Art, and Aesthetics After Code (Chicago: University of Chicago Press, 2014), 211. Original italics removed.

13

See “BIM Technical Standards: MEP Color Mapping,” U.S. General Services Administration, . Compare this hyper-specificity with the description of “structural colour” in “Our Building,” Centre Pompidou, .

14

Steven Shapin has called the screenshot a “literary technology of virtual witnessing”. See Steven Shapin, “Pump and Circumstance: Robert Boyle’s Literary Technology,” Social Studies of Science 14, no. 4 (1984): 481–520.

15

The key move of the screenshot is, as its name suggests, to show that the image is not printed or plotted conventionally but issued from a computer screen. Confusion about whether the new interactive CAD medium was a tool or a process apparently required intermediary explanation. See Matthew Allen, “Representing Computer-Aided Design: Screenshots and the Interactive Computer circa 1960,” Perspectives on Science 24, no. 6 (November-December 2016): 637–668.

16

“A piece of paper is obviously not interactive, but accepting a screenshot means believing that interactivity exists.” Allen, “Representing Computer-Aided Design,” 647 and 658.

17

Allen, “Representing Computer-Aided Design,” 658 and 664.

18

It is perhaps no accident that Allen uses the Centre Pompidou, the icon of High Tech, as an example of “how computational aesthetics (promulgated in part through screenshots) entered architectural culture”. Ibid, 662.

19

See Guy Weinzapfel, “Following the Yellow Brick Road,” in Reflections on Computer Aids to Design and Architecture, 1985, ed. Nicholas Negroponte (New York: Petrocelli / Charter, 1975), 101, footnote 1.

20

See Guy Weinzapfel, “Following the Yellow Brick Road,” in Reflections on Computer Aids to Design and Architecture, 1985, ed. Nicholas Negroponte (New York: Petrocelli / Charter, 1975), 97–99.

21

Ibid, 98.

22

“Automating Program Requirements for Healthcare Planning and Design,” ONUMA, www.onuma-bim.com/projects/seps2bim.

23

Prison abolition today, it seems, would also mean divesting from the Internet-of-Prison-Things…

24

Glasgow-born James Gowan is better known as the practice partner of renowned UK architect, James Stirling, under the short-lived (and acrimoniously disbanded) firm, Stirling and Gowan (1956–1963). Gowan, while part of the impulse, is not part of the canon. While certainly not a symmetrical comparison, the Gowan/Sterling tension recalls the typically uneven distribution of credit between project delivery and design firms; between architects of record and their spectacular starchitect peers. The distinction between design and technical expertise is particularly noticeable in complex building projects like hospitals, where it is not uncommon to have two architects on the job—one credited for the “design,” and the other, to ensure and manage its delivery. Accreditation and project credit do not necessitate the same labor value. For a heated forum debate on this division of labor, see “Designer & Architect of Record relationship,” Archinect Discussion Forum, .

25

In this context, Gowan’s hand-drawn doors and beams are “inert” because their dimensional and visual properties cannot actively perform calculations and coordination. What, then, would a “active” object be? In The Active Image, BIM historian Daniel Cardoso Llach gives a historical example: “in a computer-generated image of a house, (MIT) CAD Project engineers realized that a door could be described with information about its shape but also about its material, cost, structural properties, and other attributes. A concrete beam could be described with information such as length and height, but the same data structure could be furnished with information about its structural behavior. (This ostensibly enabled) designers to instantly perform structural and cost analysis, and could be made available to different parties for coordination. It is in this precise sense that we can talk about the postwar rise of a new, structured, image marking the origins of what is today known as BIM.” Daniel Cardoso Llach, “Architecture and the Structured Image: Software Simulations as Infrastructures for Building Production,” in The Active Image: Architecture and Engineering in the Age of Modeling, eds. Sabine Ammon and Remei Capdevila-Wering (Cham: Springer Verlag, 2017), 28.

26

See Jerry Laiserin, “Foreword,” in BIM Handbook: A Guide to Building Information Modeling for Owners, Managers, Designers, Engineers, and Contractors, Charles Eastman, et al (Hoboken, NJ: John Wiley & Sons, Inc., 2008), xiii. Unlike Gowan’s static Section, BIM is crucially known to rely on data relationships between discrete parts. This means that the non-graphical, textual and interlinking data of a thing is just as important as the geometry of the thing itself. In Charles Eastman’s Building Description System (BDS), “properties describe all non-shape aspects of an element. A property(‘s value) may be numerical or alphabetic…the designer may store any type of property with shape. Examples might be cost, color, manufacturer, function, maximum bending moment or the element’s specification.” From Charles M. Eastman, “The Use of Computers Instead of Drawings in Building Design,” AIA Journal 63 (March 1975): 49.

27

RUCAPS, according to dubious CAD history sources, stands for “Really Universal Computer Aided Production System”.

28

See Robert Aish and Nathalie Bredella, “The evolution of architectural computing: from Building Modelling to Design Computation,” arq 21, no. 1 (2017): 65 and footnote 2. Mid-sentence quote from Robert Aish, “Building Modelling: The Key to Integrated Construction CAD,” in CIB 5th International Symposium on the Use of Computers for Environmental Engineering Related to Buildings, Bath (July 1986), 55. This paper marks the first documented use of term “building modeling”. See also “Dr. Robert Aish joins Autodesk,” AEC Magazine, February 8, 2008, .

29

See Aish, “Building Modelling: The Key to Integrated Construction CAD,” 65, Figs. 3 and 4.

30

While his paper is highly conceptual, Eastman is in fact very conscious of (and concerned by) the material base of an information-heavy model: “Although representing a building in all its details within a computer may be an attractive concept, practical application…requires the development of programs that are capable of allowing the description of a very large number of elements—in the order of hundreds of thousands…It requires methods for interfacing the description with various analyses programs. Most important, it requires that such a description system be implementable on widely available hardware and that it be inexpensive and easy to operate.” See Eastman, “The Use of Computers Instead of Drawings in Building Design,” 47.

31

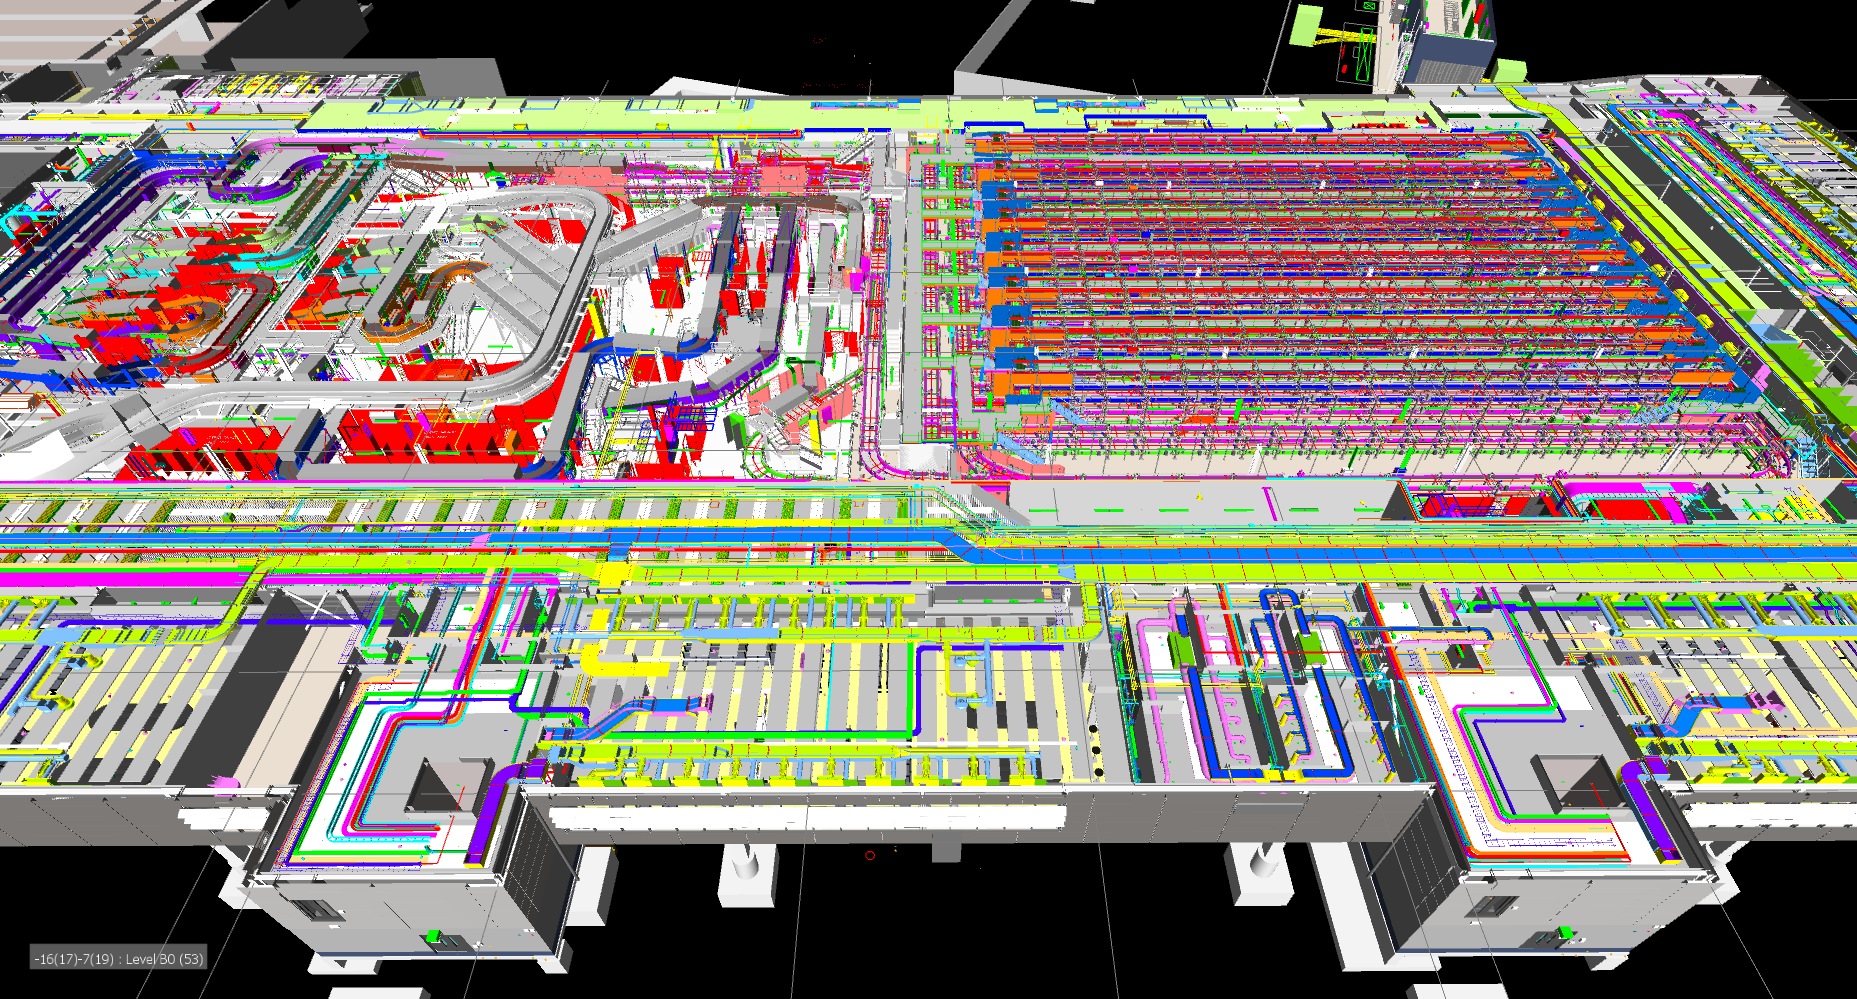
BIM software such as Autodesk Navisworks are able to perform clash detection scans, algorithmic analyses used to flag colliding elements in virtual model space. It is commonly used by engineers, architects, and contractors on complex building projects, where spatial conflicts may otherwise elude the coordinating technician’s eye. In Nabholz’s screnshot, we see a truss cutting through a mechanical duct path, and a pipe intersecting a floor joist. In 1975, Charles Eastman had already foreseen clash detection technology: “The ideal representation of a building for architectural design…would accept changes easily and provide automatic checking for spatial conflicts.” See O’Donnell & Naccarato, “Clash Detection in BIM Modeling,” Association of Construction & Development, February 28, 2012, ; Charles M. Eastman, “The Use of Computers Instead of Drawings in Building Design,” AIA Journal 63 (March 1975): 46.

32

See “The Beauty of BIM,” Nabholz, January 2014, . To be clear, Nabholz is not upheld as some emblematic BIM pioneer. The contractor is not particularly innovative, nor is it known for any “designer” architecture we might recognize. In 2018, Nabholz was ranked #107 on Engineering News-Record’s Top 400 Contractors list. Its middle-of-the-range position (and not even an AEC company; just “C”) reminds us that BIM, Virtual Design and Construction and 4D Simulation (all services offered by Nabholz) is no longer an exceptional technology nor instrument of architectural fancy, but industry standard—almost prosaically so, now harnessed as a key value proposition by run-of-the-mill builders. See “ENR 2018 Top 400 Contractors,” Engineering News-Record, May 2018, .

33

The building’s technical image is alleviated from the pictorial realm into that of simulation. Llach calls these “operative artifacts” or “structured images” which command numbers, rules, forces, and estimations. See Llach, “Architecture and the Structured Image: Software Simulations as Infrastructures for Building Production,” 23-52.

34

On the difference between traditional texts and technical visualizations, Vilém Flusser remarks: “When I envision technical images, I build from the inside of the apparatus.” Vilém Flusser, Into the Universe of Technical Images (Minneapolis: University of Minnesota Press, 2011, first published 1985), 36.

35

On the unreliability of computer simulation in architectural practice, Bazjanac continues: Architects “were basically looking for a mechanism to which they could transfer the responsibility of making guesses when they felt uneasy about making them themselves.” In the mid-70s, the computer was recognized as an externalized site of risk allocation—‘the computer did it, not me.’ Today, computer simulations are so relied upon that risk is intimately coupled with the worker: from date and author stamps of user actions to the (still nascent) integration of blockchain and RFID tags within BIM models. The computer recorded that it was you who did it. See Vladimir Bazjanac, “The Promises and the Disappointments of Computer-Aided Design,” in Computer Aids to Design and Architecture, ed. Nicholas Negroponte (London: Mason/Charter Publishers, Inc., 1975), 21, and “BIM with Blockchain,” in “Blockchain Technology: How the Inventions Behind Bitcoin are Enabling a Network of Trust for the Built Environment,” Arup, 2017, .

36

Synchro Software, “Synchro Software 4D BIM/VDC Construction Project Management,” YouTube, October 30, 2016, . Still taken at 1:02.

37

With machine-readable building information, posited Aish, models could be given rules against which to test and evaluate large, complex building designs on behalf of the user. The repetitive task of detecting clashes between pipes and structural elements, for example, “can be conveniently off-loaded to the computer, thus freeing the user to consider other more strategic issues.” Aish, “Building Modelling,” 57.

38

On Barak reads “a similarly apocryphal belief in the labor-saving and liberating effects of steam engines” which actually served to intensify and regularize labor. See On Barak, “Three Watersheds in the History of Energy,” Comparative Studies of South Asia, Africa, and the Middle East 34, no. 3 (2014): 444. On the labor behind automated industries and its imbrication in contemporary politics (in which BIM has not yet, but should be, entered into the discussion), see Julieta Aranda and Ana Teixeira Pinto, “Turk, Toaster, Task Rabbit,” in SUPERCOMMUNITY: Diabolical Togetherness, e-flux journal series, eds. Julieta Aranda et al. (New York: Verso, 2017): 333–340.

39

James F. “Jim” Blinn, the American computer scientist behind the Voyager fly-by animations for NASA’s Jet Propulsion Laboratory, formulated Blinn’s Law in the late 1970s, along with a number of other computer graphics innovations intrinsic to most rendering software today, such as environment and bump mapping. See “A Brief History of Physically Based Rendering,” in Physically Based Rendering: From Theory to Implementation, Matt Pharr, Wenzel Jakob, and Greg Humphreys, (Cambridge: Elsevier, 2017), 48–52. For a non-technical primer on the paradox of render time, see Boxx Technologies, “Blinn’s Law and the Paradox of Increasing Performance,” Computer Graphics World, July 16, 2013, .

40

Consider the Solibri Model Checker, a quality assurance and BIM validation software used by Arup and Skanska, whose taglines include “Check more, check better,” and “We revolutionize Model Checking”. See “How it Works” and “About,” Solibri, . Ironically, the software requires the architect’s Revit model be exported as a new model in a separate file format, for a BIM coordinator to review in Solibri and return as an issue report, to be followed up by the architect in the Revit model. To see this irony played out in fastidious step-by-step video format, see BIMKing, “BIM Collaboration Format between Revit and Solibri Model Checker,” YouTube, July 11, 2021, .

41

For an insight into the kinds of conscientious operation undertaken by BIM Coordinators (an emerging role in the construction industry), see Katelyn Sanchez, “Verify! Verify! Verify! Virtual BIM Coordination for Construction,” Autodesk University, conference presentation, AU Las Vegas 2018, .

42

“And of course, in some cases, having too many material choices and fittings can overwhelm even the most knowledgeable modelers.” Simon Whitbread, “Tips for Naming Pipe Types,” Autodesk Knowledge Network, August 30, 2016, .

43

“Straight pipe waste, DN 400,” BIMObject, .

44

The absurdly meticulous cataloguing of applied 3D objects even extends to materials invisible to the eye, such as clear primer. Ardex’s Solvent Based Primer is one such product, now available as its own “Building_Materials-Solvent_Based_Primer-ARDEX_WPM_270.rvt” Revit file. See BIMObject, .

45

Allen Sekula has written on the proliferation of photographic practices in 19th century France and how the (highly racialized) development of police archives and indexing systems emerged in tandem. While criminology is markedly different from construction (or perhaps not so, given the existence of parametric prison object libraries), Sekula usefully reminds us that the archive is a system of power, and “that we would be wise to avoid an overly monolithic conception of realism”. See Allan Sekula, “The Body and the Archive,” October 39 (Winter 1986): 64.

46

World Economic Forum with The Boston Consulting Group, “Shaping the Future of Construction A Breakthrough in Mindset and Technology,” World Economic Forum, May 2016, 38, .

47

“BIM and prefabrication require high quality, real-world content.” See “Trimble Managed Content,” Trimble MEP, .

48

Today many platforms not only host content but also provide BIM content creation services—the digital model has its own factory. As one platform MEPcontent put it: “Do you want to prepare your products for BIM? Provide us with the product data and we ensure that your products become available in high quality models on MEPcontent so engineers can download them from all around the globe…Whether you want rapid production from a parametric database, enriched families or you require a custom-made app, our content factory meets your demands.” See “Create BIM content in our factory, MEPcontent, .

49

For distinctions between “dumb graphics” and “intelligent” objects, see Rick Rundell, “1-2-3 Revit: Not All BIM is Parametric,” Cadalyst, February 15, 2005, .

50

See Hito Steyerl, “In Defense of the Poor Image,” e-flux 10, November 2009, .

51

“All About the IoT: How Sensors, Gateways, and the Cloud Form the Internet of Things,” Laird Connectivity, October 1, 2019, .

52

Revit calls its parametric components Families. Broken Families (i.e. objects that don’t inter-associate properly and are thus no longer “smart”) have been a perennial source of frustration for BIM users everywhere. See, for example, forum post by mark b, “2015 Broken my families,” Revit Forum, May 5, 2014, ; forum post by Jessicas, “Family constraints breaking for unknown reason,” Autodesk Knowledge Network, April 6, 2017, .

53

Paradoxcially, “dumb” documentation may still be the currency of the day. Trimble’s business manager of engineering Stuart Broome has remarked that engineers are contractually bound to “dumb down” their 3D models into 2D drawings for clients, and that “engineers may be afraid of providing too much detail in models that would make them accountable if something goes wrong in a project. Architects and constructors also tend to adopt this risk-averse position, based on personal conversations with a professor at Texas A&M’s Construction Science Department in November 2018. See Michael Molitch-Hou, “BIM and AEC in 2018: Industry Leaders Weigh in,” engineering.com, December 29, 2017, .

54

See “Online 3D Navigation,” Ecodomus, .

55

“Personnel & Occupancy,” SpaceIQ, .

56

In order of appearance: “Online 3D Navigation,” Ecodomus, ; Carla Lauter, “Geomap 3D CAFM provides user-friendly FM in NavVis IndoorViewer,” Spar3D, August 21, 2019, ; “Smart Client Extension for Revit,” ARCHIBUS, .

57

“The economic value of BIM technology is often weighed by measuring the ratio of return on investment, or ROI. Adopting BIM processes is becoming increasingly popular at all stages of the building’s lifecycle – that is, from design to construction and through operations and maintenance. Consequently, the role of ROI in technology-decision making is shifting.” Erin Rae Hoffer, “Achieving Strategic ROI: Measuring the Value of BIM,” Autodesk, 2016, 4, .

58

Trimble, for example, now provides Mixed Reality (AR with real-time feedback) software for architecture, engineering, construction, mining and utilities disciplines. Trimble Connect for Hololens is a wearable eyepiece that overlays precise and cloud-updated holographic data over the individual worker’s real field of vision on a job site. According to one construction worker piloting the technology, the value of such Mixed Reality vision would be in remodeling projects, where the model can be coordinated on site against “what’s already there.” See “Mixed Reality,” Trimble, ; Trimble MEP, “Construction workers try Trimble Connect for HoloLens for the first time.. here is what happened!,” YouTube, January 24, 2018, .

59

See “BIM 360 Ops,” Mac AppStore, .

60

The integration of BIM and FM into a 7D model has been called an “electronic owner’s manual” that capitalizes on the data-rich BIM model for building management. See Claire Mao and Dusan Selezan, “Integration of BIM and Facility Maintenance: What Does the FM Crew Really Need?” Autodesk University, .

61

See Wired Brand Lab, “Creating a building’s ‘digital twin,’” IBM Internet of Things, November 1, 2017, .

62

The term “digital twin” term was coined in 2003 by Michael Grieves for his Product Lifecycle Management (PLM) courses at the University of Michigan. Like CAD history, the technology was initially envisioned for automotive and aviation industries, later expanded to encapsulate buildings and civil infrastructure, from transport to water. For a recent report explaining this, see “Digital Twin: Towards a Meaningful Framework,” Arup, November 2019, .

63

Jim Baumann, “Digital Twin Helps Airport Optimize Operations,” ESRI, 2019, .

64

“The constant vigilance—or presence, really—of a building’s ‘digital twin’ offers other more subtle benefits” such as solving “the mystery of a broken piece of critical machinery” via the scanning of surveillance footage. Ibid.

65

See Mark Venables, “Digital Twins Provide A Window Into The Future For Ageing Assets,” Forbes, August 26, 2018, ; Aaron Parrott and Lane Warshaw, “Industry 4.0 and the digital twin: Manufacturing meets its match,” Deloitte Insights, May 12, 2017, ; “The ‘digital twin’—a bridge between the physical and the digital world,” coBuilder, July 5, 2018, .

66

Michel Feher, Rated Agency (New York: Zone Books, 2018), 19. Simulation software is also being used to “strengthen” manufacturers’ business cases. In the Autodesk promotional article introduced in footnote 2, HUNTAIR, Inc.’s Healthcare director Kevin Schreiber makes a statement that directly ratifies Feher’s claim: “Having Autodesk technology as a part of the process lends credibility to what we’re saying, and that’s huge.” See “HUNTAIR, Inc. uses BIM to help hospitals reduce post-operative infections”, Autodesk, .

67

This is a play on Bruno Latour’s famous articulation that drawings draw things together. The building information model, quite literally, gathers together all kinds of building data over time into a single linked database for future production. See Bruno Latour, “Visualization and cognition: Drawing things together,” in Knowledge and Society Studies in the Sociology of Culture Past and Present 6, ed. Henrika Kuklick (Stamford: JAI Press, 1986), 1–40.

Software as Infrastructure is a project by e-flux Architecture as part of “Eyes of the City” at the 2019 Bi-City Biennale of Urbanism\Architecture (Shenzhen).

Category
Architecture, Design, Data & Information, Drawing, Technology
Subject
Automation, Artificial intelligence
Return to Software as Infrastructure

Amelyn Ng is an Australian architect, writer, and cartoonist currently working on issues in graphics, epistemology, and theories of information-richness. She is a 2019 Wortham Fellow at the Rice School of Architecture, and a graduate of the Critical, Curatorial and Conceptual Practices (CCCP) program at Columbia GSAPP.

Advertisement
Subscribe

e-flux announcements are emailed press releases for art exhibitions from all over the world.

Agenda delivers news from galleries, art spaces, and publications, while Criticism publishes reviews of exhibitions and books.

Architecture announcements cover current architecture and design projects, symposia, exhibitions, and publications from all over the world.

Film announcements are newsletters about screenings, film festivals, and exhibitions of moving image.

Education announces academic employment opportunities, calls for applications, symposia, publications, exhibitions, and educational programs.

Sign up to receive information about events organized by e-flux at e-flux Screening Room, Bar Laika, or elsewhere.

I have read e-flux’s privacy policy and agree that e-flux may send me announcements to the email address entered above and that my data will be processed for this purpose in accordance with e-flux’s privacy policy*

Thank you for your interest in e-flux. Check your inbox to confirm your subscription.