


The insurance industry is an influential consolidator of knowledge about risk. Accident after accident and plague following plague, insurers earn their keep by amassing data about hazardous events and the people they affect. Information about past losses allows insurers to “peer” into the future. With sufficient data points, an insurer can estimate the probability that a specific calamity will befall a random individual pulled from the population at large. This actuarial knowledge helps an insurer set a price for their services, but it also has immense consequence for other sectors of economic and social life.
In the realm of real estate, for instance, the ways insurers assess natural disaster risk influences both the constructability and design of the built environment. Insurers know which buildings suffer more damage under different disaster conditions, and adjust their underwriting accordingly.1 With the advent of climate change, however, nature is no longer behaving like it used to, and past data is becoming less predictive of future events.2 As a result, insurers, and the auxiliary analytics firms who serve them, are under pressure to develop new strategies for managing exposure to climate-enhanced risks. These new strategies rely on making the built environment more legible to risk assessment, but in doing so they also create new vulnerabilities for individual policy holders.
Simulating Catastrophic Events
Extreme weather has long posed a challenge to traditional modes of risk assessment. Because catastrophic events are relatively rare, they are not amenable to the actuarial statistics that define other insurable losses (such as auto accidents, home burglaries, or incidences of cancer). This problem of “non-calculability” changed in the 1980s, when a group of third-party companies called catastrophe, or “cat” modelers developed a way of estimating the occurrence of natural disasters using computer simulations.3 These companies emerged explicitly to serve insurers who, up till then, had often relied on informal techniques for assessing their exposure to catastrophes.
Cat models succeeded in adding precision and accuracy to estimate efforts by combining multiple forms of expertise. The “hazard modules” of the models uses stochastic methods to generate thousands of modeled catastrophes based on parameters from past disasters (i.e. earthquakes, floods, wildfires and extreme weather). Meanwhile the “damage module” encodes engineering information about the built environment, pulling from databases containing details about all the fixed assets in an insurer’s portfolio (i.e. types of buildings, the materiality of these structures, and their construction dates). Finally, a financial loss model translates physical vulnerabilities into dollars and cents.
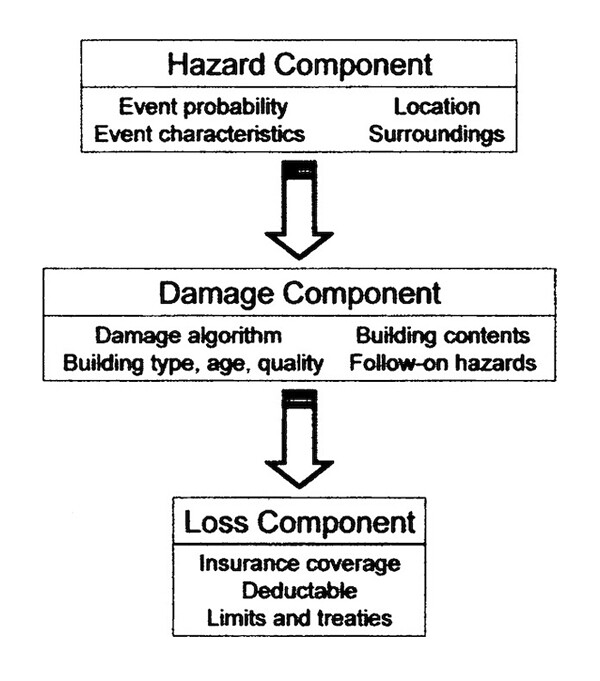

Schematic of a catastrophe model, with its three modules: the hazard module, damage (or vulnerability) module, and financial loss module. The design of the models has remained virtually unchanged since they were first developed in the mid-1980s. From Richard Murnane, “Catastrophe Risk Models for Wildfires in the Wildland-Urban Interface: What Insurers Need,” Natural Hazards Review, 7, no. 4 (2006): 150-156.
Each type of disaster follows the general formula, with obvious tweaks and adjustments. Considering North Atlantic hurricanes, modelers take the small record of historical landfalling hurricanes (less than two-hundred data points) to produce plausible “synthetic” storms in the hazard module.4 These synthetic events unfold in a simulated version of the North Atlantic basin where, much like the real world, many spin harmlessly out to sea. Eventually, however, some storms turn inland where their virtual trajectories bring them in contact with the US shoreline. This encounter between the destructive winds of a synthetic hurricane and a computer-copy of a coastal community occurs over thousands of iterations in the model until a statistical distribution is reached that represents the spread of storms likely to strike a given territory (if it were possible to collect that number of observations, something that would take thousands of years). This distribution is what produces actuarial-ready damage estimates.
Initially, the simulation of hazards solved the pervasive underestimation of risk that plagued insurers’ earlier assessment techniques. But climate change raises new questions about loss estimates based on catastrophe models. This is particularly true as natural disasters appear to be becoming more destructive, eroding the usefulness of historical baseline data.5
One response of cat modelers to these changes in extreme weather has been to try and combine data from projective climate models with their simulation techniques. So far, it has been an uncomfortable fit. Climate models are based on thermodynamic equations of atmospheric behavior, and the computational demands of dynamically (rather than stochastically) estimating phenomena like hurricane activity remains an expensive and commercially untested approach to property-level disaster estimation. This has pushed cat modelers to take scientific shortcuts that have produced questionable loss estimates, which in turn have compelled US insurance regulators to exclude new models from being used to set rates for homeowner insurance.6


Due in part to the challenges of climate change, cat modelers are now working to create more legitimacy in their troubled hazard simulations by expanding their knowledge about the built environment. The more information modelers have about the buildings in their databases, the better they can forecast how a building will react under different stresses. This tightens the accuracy of the loss estimates they sell to insurers, regardless of what the weather is doing. Modeling firms, therefore, are in a race to accumulate “comprehensive” data about existing structures in the US.
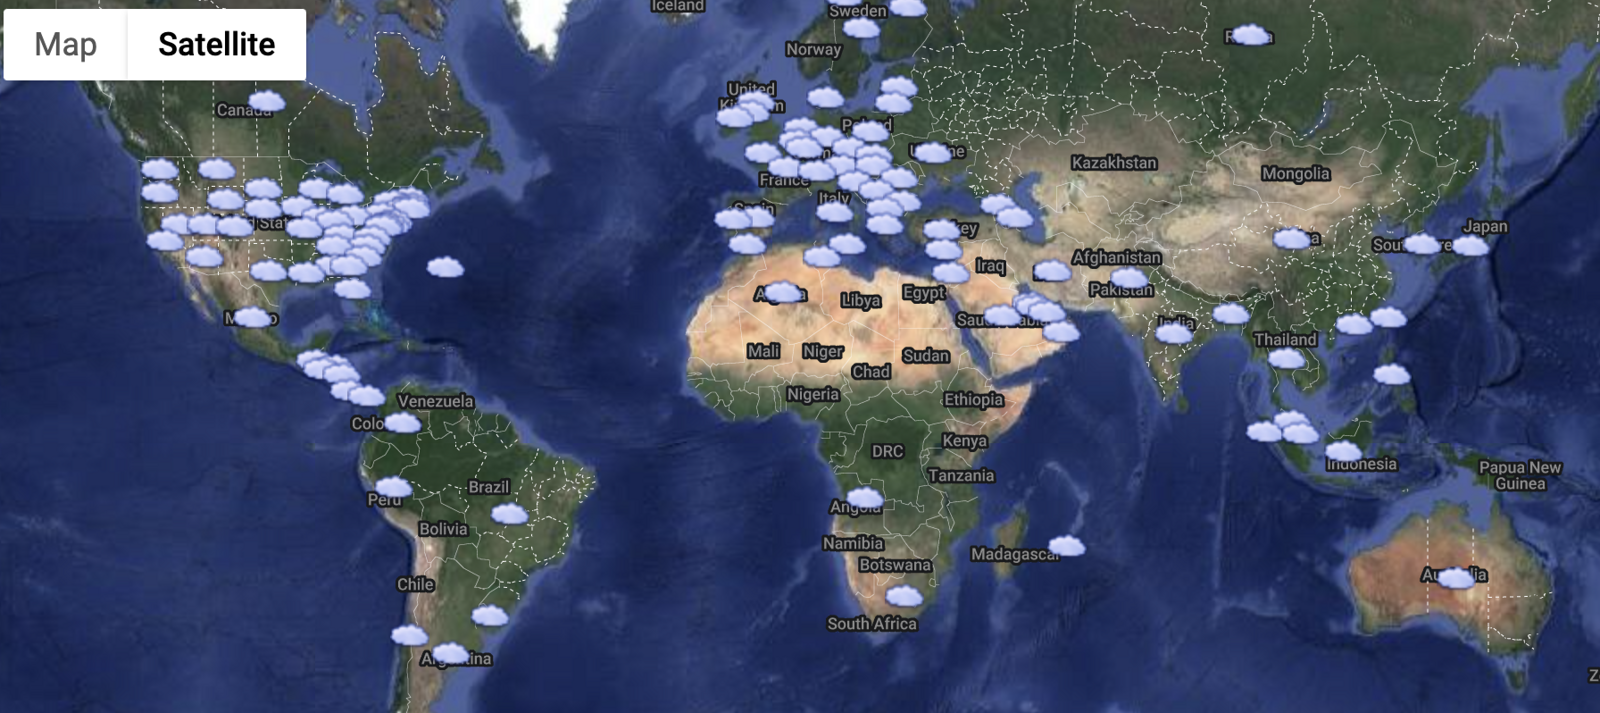
Some of the cheapest ways to do this are through spatial imagery captured by drones and planes, or by scraping the web for existing photos of buildings. While partly intended to stabilize confidence in insurers’ tools of catastrophic risk assessment, these data practices also partake in broader economic trends of harnessing consumer data, often unbeknownst to the consumer, in order to build more predictive knowledge about individual behavior to the advantage of those who gather the data.7 By subjecting the private spaces of our homes to new forms of corporate observation, insurers’ moves toward “comprehensiveness” resemble what the business scholar Shoshana Zuboff calls “surveillance capitalism.”8 The unpredictability of extreme weather provides a justification to scrutinize our homes and businesses in an unprecedented way, coupling the promise of cheaper and more reactive insurance products with yet unforeseen revenue streams offered by new forms of big data. But while better data on buildings may help reduce insurers’ exposure at the level of their portfolios, it also has the potential to introduce consumers to new algorithm-related risks.
Cataloguing Vulnerabilities
Collecting data on the vulnerability of the built environment is a never-ending task. New construction blends with old as building materials change and designs evolve to meet architectural standards of the day. Property underwriters have an interest in knowing both the value and the characteristics of the structures they insure. As a result, insurers, and the cat modeling firms they employ, gather rudimentary information on what an early theorizer of cat models called “elements-at-risk”: a catalog of all the buildings contained in an underwriter’s portfolio of insurance policies.9 This information is also known as an insurer’s “exposure data,” or more colloquially, the “book of business.”
From the modeler’s perspective, the most important data about the “elements-at-risk” are their location, occupancy, height, construction type, and year of construction. These are considered the “primary characteristics” of a building and the principal ingredients that a cat modeler uses to assesses the building’s vulnerability. For instance, a building’s occupancy depends on its function: is it a residential, industrial, or commercial building? If residential, is it a single-family or multi-family home, apartment building or a condominium? Construction type captures core materials used in a building’s structure: is the building made from wood or masonry? Is the masonry reinforced or unreinforced? If reinforced, is it by steel or by concrete? Height, meanwhile, matters for perils such as wind, fires, and earthquakes, as these events interact differently with tall structures compared to shorter ones. And date of construction serves as a proxy for information about the quality and design of a building—implied by the evolution of local building codes.
This data is stored by modelers in attribution tables that serve to construct mathematical relations between different classes of buildings and their potential for loss under different disaster scenarios. For many buildings, this data is incomplete and modelers have to enter dummy variables into their tables, reducing the accuracy of their forecasts.10 Some property owners—particularly of high-value commercial structures—have sought ways to improve how modelers measure their vulnerability in order to reduce their premiums. The owners do this by paying inspectors to collect data on what are called “secondary characteristics.” For commercial and office buildings, these characteristics include finer grained categories of structural design, such as whether parking garages are part of the structure or not. If so, are they below ground or above ground? Is the HVAC system on the roof, or internally housed? Are objects inside the building water vulnerable, or water resistant? Are the windows tempered glass or impact-resistant? Each characteristic implies a different relationship to vulnerability.
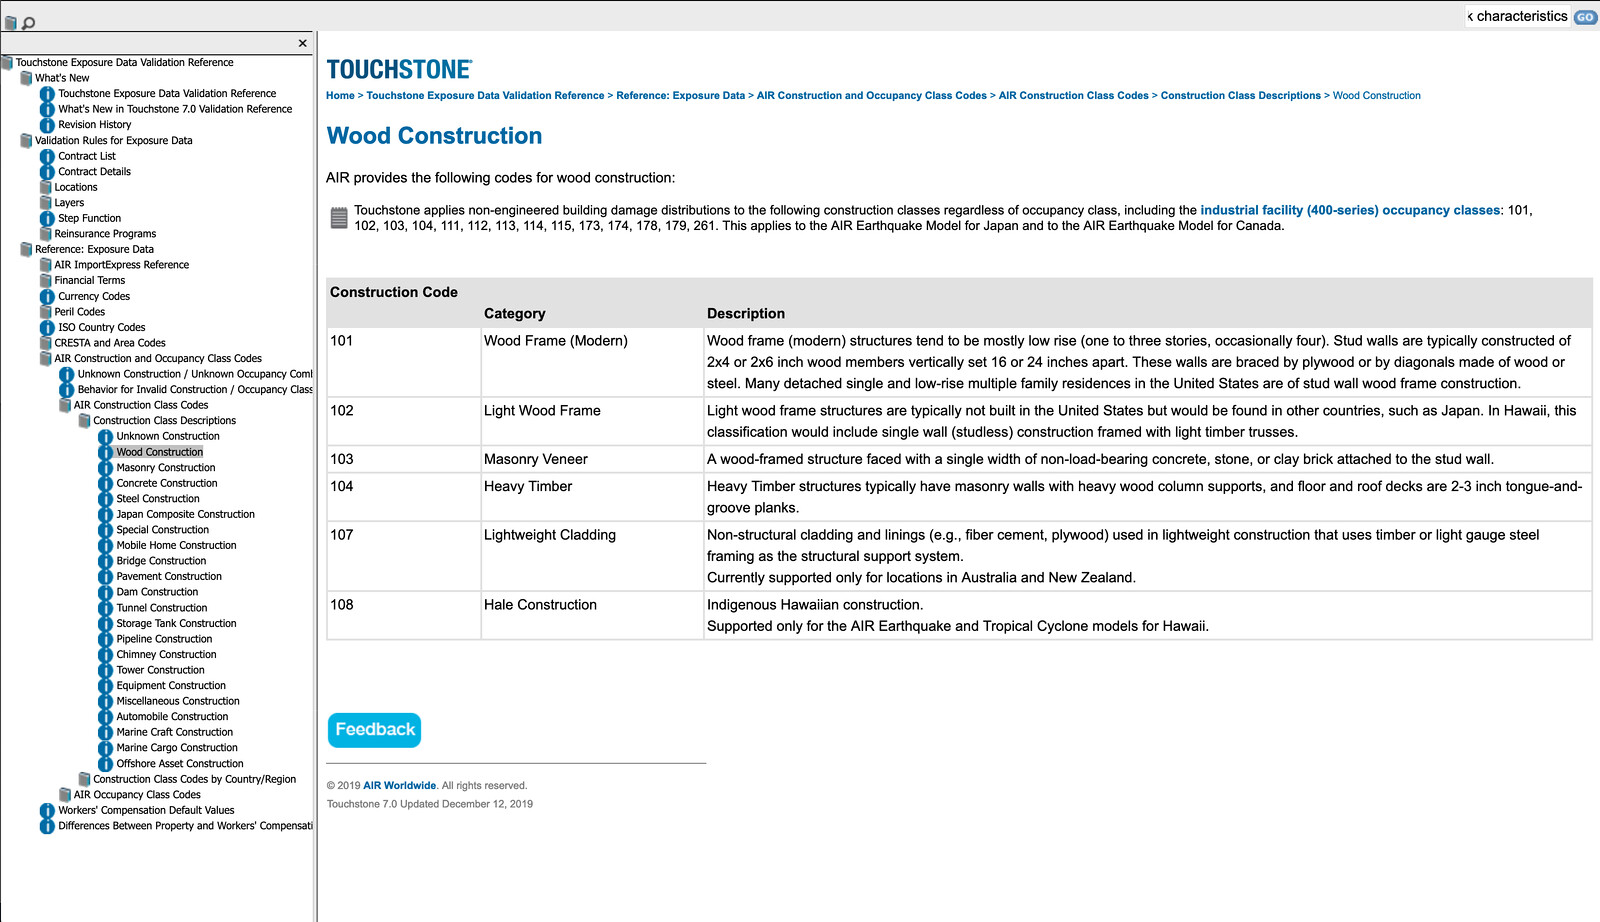

To keep track of the information on “elements-at-risk”, modelers assign codes to each characteristic of a building. These coding schemes, with names such as the Universal Cession Electronic Data Exchange (UNICEDE) and Exposure Data Model (EDM), provide a “data dictionary” of the built environment. Each coded category tethers information about structures in the real world to a standardized taxonomy that is used to catalog and populate a virtual version of insured property within a catastrophe model. The meaningful information for insurers, however, is to understand the potential losses that a natural disaster, such as a hurricane, could inflict if it encounters the buildings in their portfolio.
Predicting Loss
The damage caused by an event such as a hurricane can be defined mathematically as the effects of a force, in this case wind velocity, on the material integrity of a structure in a hurricane’s path. As velocity increases (101mph, 102mph…155mph), structural integrity decreases, until at some point a building is completely compromised (100% damage). Don Friedman, a pioneer of catastrophe modeling, conceptualized this as the “vulnerability relationships of ‘elements-at-risk.’”11 In current versions of cat models, this notion of a vulnerability has been further formalized into a family of algorithms called “damage functions.” These mathematical equations predict the behavior of the primary and secondary characteristics of a building to different perils and sub-perils (earthquakes, fire, floods, and wind, as well as direct wind, wind-borne debris, and wind-driven rain), and allow insurers to estimate what is called the “replacement cost value” for a structure. For each structural characteristic of a building identified in the catastrophe model coding scheme, there exists a damage function.
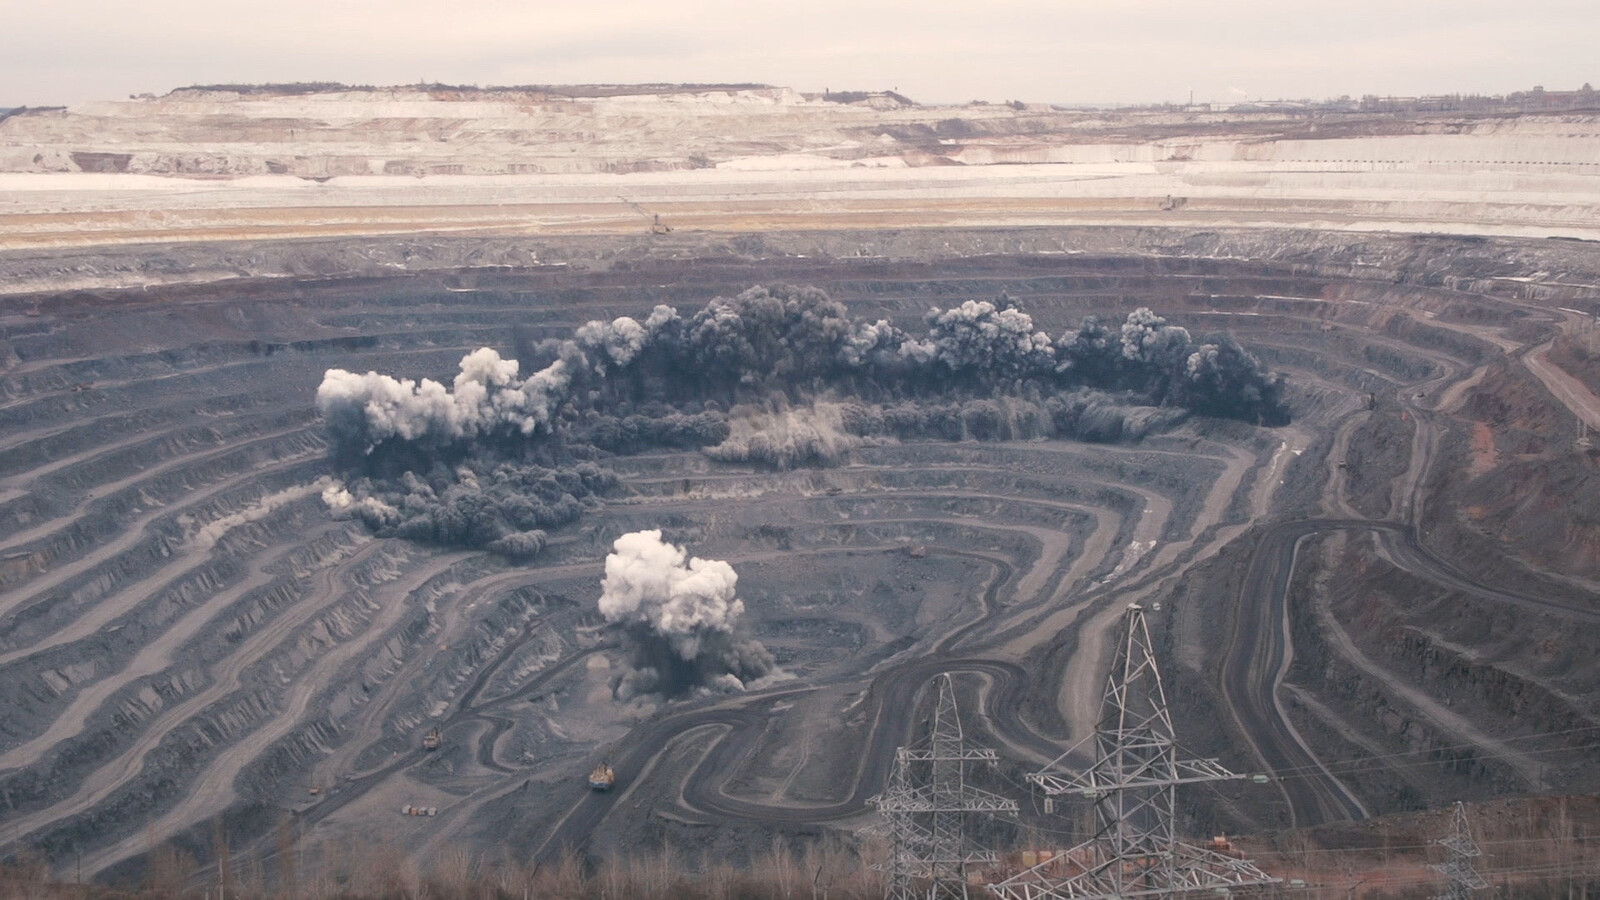
Modelers frequently add new characteristics to their vulnerability catalogues following major disaster events, when the performance of entire populations of buildings become momentarily visible. On-the-ground survey teams travel to disaster areas and gather observations that can lead to changes in how cat modelers craft their predictive equations. Following the 2004 and 2005 hurricane seasons, for instance, two new categories of commercial “occupancy” were added to the models—riverboat casinos and gas stations. Both structures suffered an inordinate amount of damage that the models had grossly underestimated, leading to higher than expected losses for insurers. New damage functions were written to capture the specific vulnerabilities of both occupancy types. Higher vulnerability frequently translates into higher premiums, and depending on the geography, increases can be significant. In some coastal areas of the US, up to forty percent of insurance premiums can go toward covering catastrophic risk and reinsurance costs.12
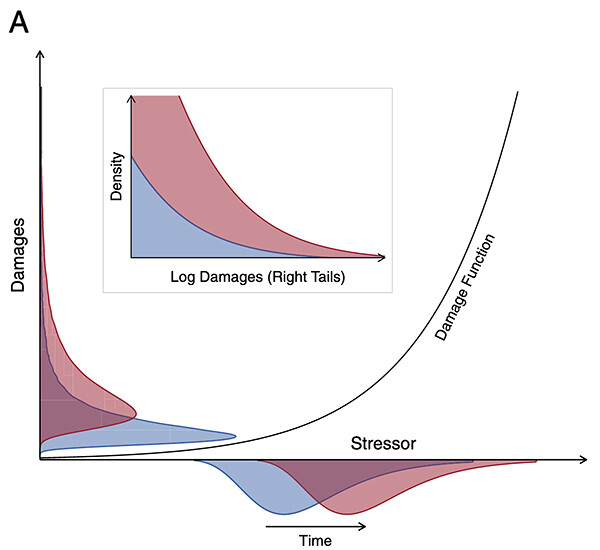

Stylized representation of a convex, upwardly curved transfer mechanism from stressor to damages. In the inset, the horizontal axis shows the largest damages (upper range of the vertical axis in the main image) on the log scale. From Matteo Coronese et al., “Evidence for sharp increase in the economic damages of extreme natural disasters”, Proceedings of the National Academy of Sciences, 116, no. 43 (2019): 21450–21455.
While “ground-truthing” by modeling teams provide an important feedback loop between the virtual and the material, perhaps the most abundant sources of data for establishing damage functions are insurers’ in-house “loss data.” Described by one cat modeler as “insurers’ own version of ‘big data,’” loss data arrives in a steady stream after a disaster when homeowners and small businesses make claims against their policies and adjustors descend to determine the veracity of the claims.13 By comparing exposure data (primary and secondary characteristics of elemets-at-risk) and loss data (what actually happened), insurers can correlate information about the properties in their portfolio and the actual amount of damage, per property type, caused by a disaster event. The differences in what the models predicted and what actually happened provides new opportunities for further fine-tuning damage functions.
Controlling for the Human Factor
Other challenges exist for estimating vulnerabilities. The built environment is not static, and social responses to risk influence and change the behavior of structures overtime. These changes are frequently bound up in efforts to improve what are known as buildings codes: local rules for minimum construction standards that developers and contractors must follow to receive a permit to build..14 Experience has shown that codes are often imperfectly implemented, meaning that codes themselves cannot be taken for granted. Building codes are therefore a major confounding factor for modelers in terms of making assumptions about an underwritten property’s exposure.
To control for this uncertainty, modelers have introduced assessments of the robustness of building code enforcement into their models. Verisk Analytics, the parent company of major cat modeler Applied Insurance Research (AIR), has a subsidiary company that maintains the Building Code Effectiveness Grading Schedule (BCEGS), which ranks many communities in America on a scale of 1–10 to determine how well they implement the building codes on their books.15 Better ranking creates insurance discounts, whereas poor ranking gives modelers a justification to handicap their models, weighting damage ratios above what the building code would normally imply to reflect the lack of quality control.
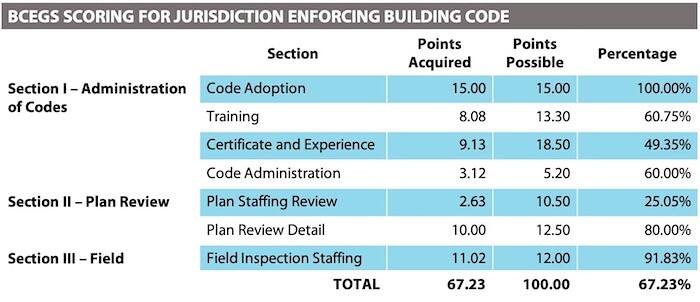

Recreation of Building Code Effective Grading Schedule (BCEGS) scoring found in a generic Building Underwriting Report (BUR). The percentages produce the score (1-10) that cat modelers use to adjust the weight they apply to building codes in their damage modules.
The inability to take building standards for granted is only one obdurate link in a chain of difficulties facing modelers in their attempts to virtualize the built environment. Poor exposure data is another source of resistance in accurately estimating potential damages. Primary characteristics for a single building, or a whole set of buildings in an insurer’s portfolio, might be incorrectly coded or simply unknown. There is no central government repository in which building resides. Modelers frequently receive their data from their clients (insurance companies), who in turn gather data from their agents or customers. It is hard to standardize such a dispersed, ad hoc process of data collection, and modelers are often forced to populate their data tables with stand-in variables for unknown characteristics. These false, or fictional, numbers, are essential for formal calculation processes , but they may under- (and more likely over-) represent actual vulnerabilities.16
Previously, these persistent data difficulties were too daunting and labor intensive to rectify, so modelers just lived with them. But now, as cheap technologies for producing imagery of building structures become more available, there is opportunity to start filling these holes through the comprehensive collection of exposure data. Seeking more knowledge about “elements-at-risk” has also become a good business argument for managing the erosion of model accuracy due to shifting climate patterns. Finally, true to the spirit of “surveillance capitalism,” companies are banking on the fact that this extra private property data carries within it value that goes beyond its use in improving damage functions. The more comprehensive the data, the greater the value.
Comprehensiveness
From insurers’ perspectives, making data comprehensive involves enhancing information about their exposure to loss. Exposure is the information that insurers—not just property insurers, but all insurers—require a prospective policyholder to share about the underlying risk for which insurance is being sought. Exposure is pre-existing health conditions, the age of the driver, an individual’s smoking habits, and the structural design of a building. It is the information that helps an insurer determine how much premium they are going to charge to underwrite a risk. Comprehensiveness, as a commercial imperative, targets exposure by leveraging the explosion of continuous, real-time, risk-relevant customer data that is becoming available in nearly every branch of insurance, from medical and health insurance to auto and life insurance.17
In the auto sector, for instance, insurers now offer pay-as-you-drive insurance. Individuals willing to share odometer data can receive reductions to their premiums by showing that they drive less than average, and thus pose less of a risk of causing or suffering an accident.18 Auto insurers are exploring even more personally tailored insurance based on actual driving behavior. Some companies are offering reductions to drivers willing to install monitoring devices within their car that upload a constant stream of telematic data tracking when drivers accelerate rapidly, brake suddenly, turn a hard corner, or even take their eyes off the road.19 In the health sector, similar innovations are afoot. Insurers are exploring providing customers insurance savings if they link fitness-trackers like Fitbits or apps like Strava to measure exercise behavior and commitments to healthiness that might differentiate an individual’s risk of, say, cardiac arrest from the rest of the population.20
This same trend of comprehensiveness, and its underlying economic argument, is also affecting property and casualty insurance, and the cat modelers who serve them. The idea that better data leads to better pricing is a hard rationale ignore. As Mahmod Khater, Chief Technology Officer (CTO) of CoreLogic, a cat modeling and property data company, explains:
If you actually start with the uncertainty in the [cat] models, the highest uncertainty exists in exposure for any insurance company or reinsurance company. So, when we do the modeling without this kind of [exposure] information, we have to make assumptions. Making assumptions means uncertainty, but there’s all this good data…that would allow us to eliminate most of this uncertainty. It would allow us to know what kind of buildings are there, and then use them to really quantify the value of the buildings, and use that in the [insurance] process.21
“All this good data” refers to new, “secondary” sources of exposure data that go beyond the typical set of “primary characteristics” (occupancy, construction type, height, age) that cat modelers use for current risk estimates. Higher resolution information can have a major influence on assessing the replacement cost value of a home, the base metric used for setting homeowner insurance premiums. For residential property, expanded secondary characteristics include information on roofs, pools, and other adjacent structures, and interior content such as marble or granite countertops and wood floors. In high wind areas, for instance, hip roofs (roofs that slope down on all sides of a house) withstand hurricane winds much better than gabled roofs (the typical A-frame-looking roof), and metal roofs tend to remain affixed better than clay-tile roofs (and cause less damage to other surrounding structures). This information is currently not included in most cat models, but gives insurers a much better idea of the kind of damage a particular home might suffer in a hurricane compared to a neighbor’s home.
Bringing data on “secondary characteristics” into a cat modelers’ exposure databases has until recently been cost prohibitive. This information is difficult to collect, requiring on-site visits by real people with clipboards and pens in hand. Inspections aimed at gathering secondary building characteristics are typically only done for large commercial property holders.22 From an insurer’s perspective, however, residential structures are what account for the majority of losses in catastrophes such as hurricanes. Yet only in the past half-decade has collecting secondary exposure data on private dwellings become cheap enough to turn into a line item for cat modeling companies. The rapid commercialization of drones capable of surveying buildings from above and web-scrapping technologies that can tap into portfolios of images from realtor websites has brought new species of big data into contact with cat modelers’ exposure databases.
Mowing the Sky
Verisk Analytic’s strategy to improve the predictive capacity of their damage functions is tied to their investment in an aerial imagery subsidiary called Geomni. Residential structures, unlike commercial buildings, are produced at volume and follow a relatively limited set of designs. And one of their most vulnerable components—their roofs—are visible from above. Getting better information about roofs is a priority for the industry, where current studies estimate that mis-categorization of roof age alone costs insurers in the US over $1 billion annually in overwritten policies.23
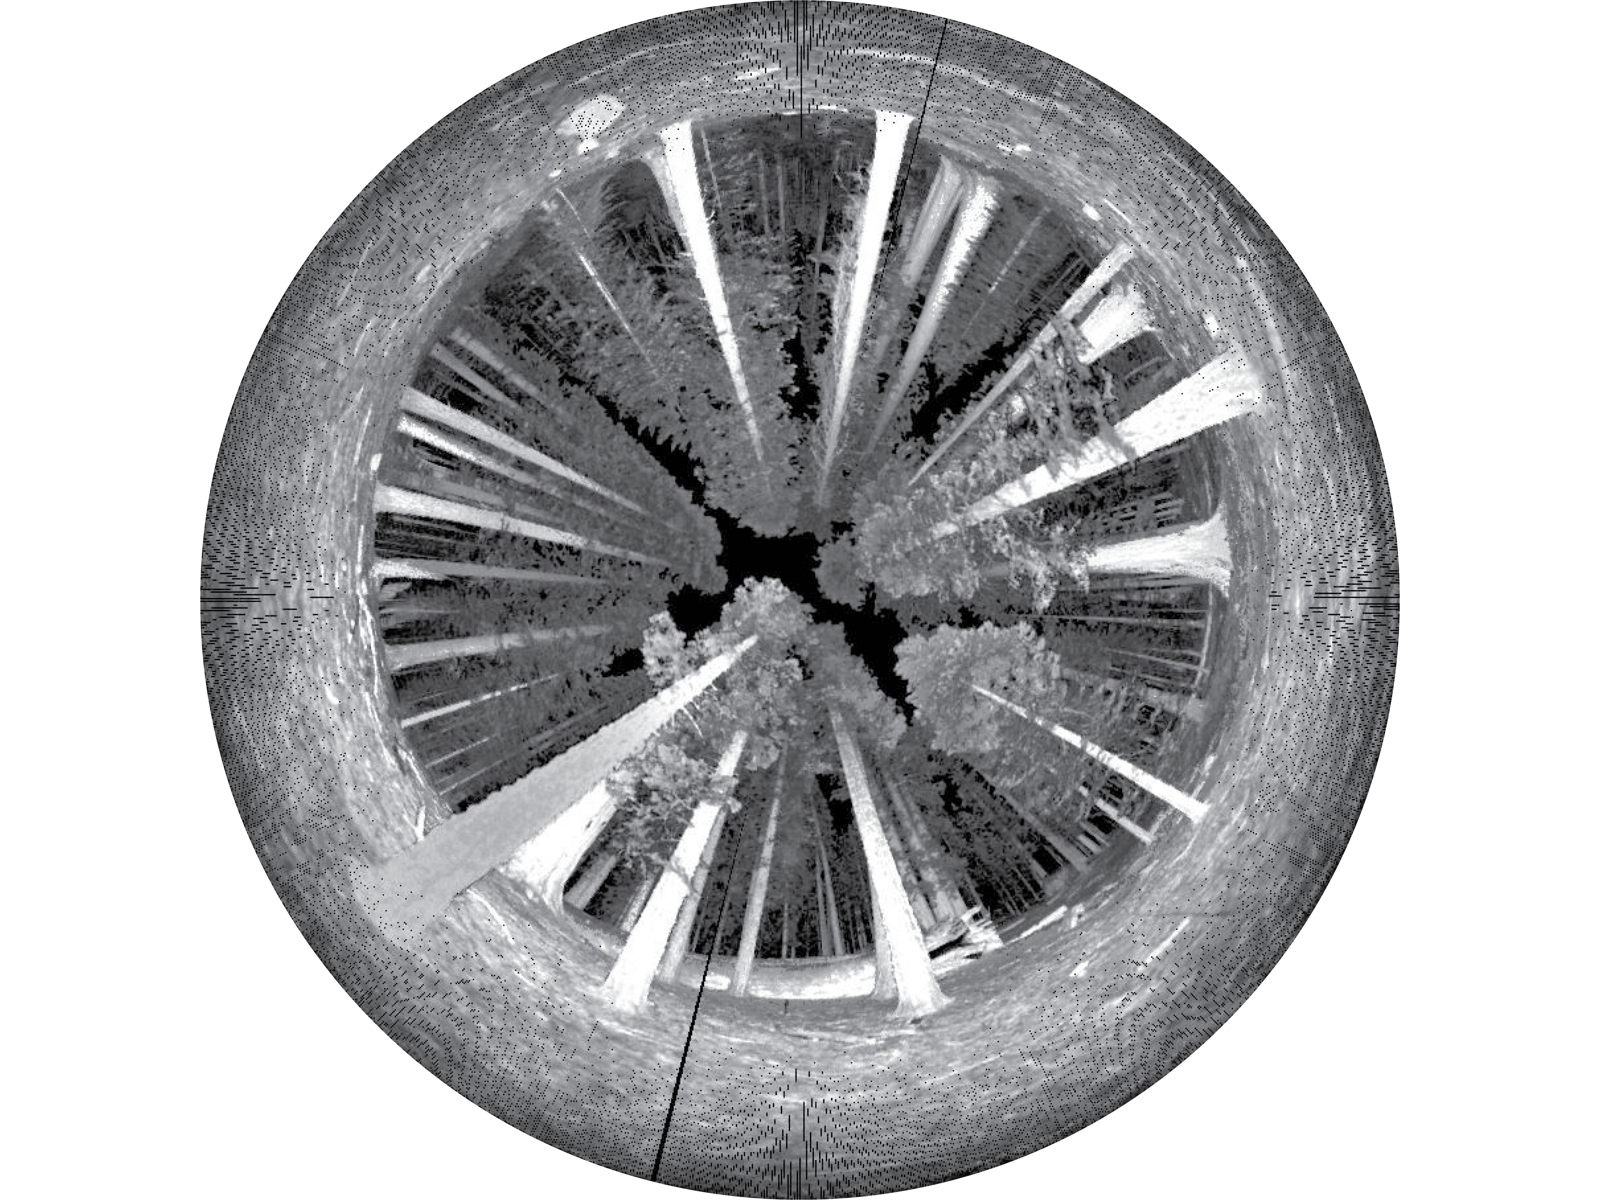
Geomni operates a fleet of around one hundred fixed-wing aircraft and unmanned aerial vehicles located around the country that conduct systematic scans of all the property in a given territory, providing high-resolution oblique and orthogonal imagery refreshed between one to three times a year for every corner of the continental US.24 By “mowing the sky,” as a senior catastrophe modeling executive described it to me, the company develops multiple perspectives on the same property. The imagery can then be used to model the property volumetrically using photogrammetry, which matches pixels in an image to the object in the real world (say roof type and texture), and then subjected to machine learning algorithms, which improves the matching process as the image base grows over time. This data is combined with other information about the built environment and fed into a cat model for a “true ground reality.”25
Aerial imagery can be used by cat modelers to: 1) determine to what extent an insurers’ exposure data matches the imagery of the buildings they’re underwriting; 2) mitigate moral hazard by relying on machine learning results for information about property, rather than turning to homeowners for that information, as is currently done; and 3) provide more stability of risk assessment by cat models (i.e. augment the overall property exposure databases).26


The business proposition, according to Geomni’s promotional site, is to create a unique repository for data on secondary building characteristics that insurers “can use…to accurately understand growth and change, determine damage, discover hazards, assess risk, and perform valuations.”27 The company collects information on building footprints, roof shapes, roof types, roof slopes, swimming pools, outbuildings, percentage of tree cover, and more. Additionally, the company can deploy its aircraft within 48 hours of when a disaster occurs to conduct pre- and post-natural disaster image processing. This can provide an augmented version of the in-person “damage survey,” which in turn can feed back into improving damage functions and estimates of vulnerability.
The Complete View of Property®
While Geomni focuses particularly on the exteriors of structures to improve risk estimates, other competitors are collecting, aggregating, and modeling information about the interiors of homes and packaging this data for actuaries. CoreLogic, another major cat modeler, is also a provider of property information and analytics to the mortgage and real estate sectors. It was founded particularly to assist mortgage lenders in preventing borrower fraud and managing collateral risks, such as natural hazards, to underlying property assets. CoreLogic’s Structural Risk and Valuation unit has developed an approach marketed as the Complete View of Property® that combines hundreds of sources of data to generate detailed information about both the exterior characteristics of a building and its interior components.
A major difference from Verisk’s efforts to “mow the sky” is CoreLogic’s efforts to estimate building contents (i.e. the kind of building materials and goods inside of a home). This is an incredibly difficult process that has been almost wholly dependent on information provided by individual homeowners or home assessors. Yet, as a property transaction company, CoreLogic builds products for the real estate sector, including a software platform that hosts Multiple Listing Services (MLS). MLS systems are the backbone of local real estate markets, allowing brokers within the same territory to access other brokers’ listings, thus matching buyers and sellers while providing each broker a commission from any sales jointly arranged. Hundreds of MLS systems have been set up by local realtor associations in the US, and CoreLogic has become a major provider for hosting MLS transactions.
In exchange for their services, CoreLogic secures license rights to some of the data stored on these platforms, including photos of listed properties. Thanks to these agreements, according to the group’s marketing pamphlets:
Insurers now have a virtual window into a home and can easily validate property characteristics without leaving their desks. For underwriters and agents, this means increased efficiency at point-of-sale and happier homeowners since they no longer have to answer a seemingly endless string of questions about their home…With an average of 13 interior and exterior photos per residential address, [CoreLogic] will help you identify hidden risks such as an in-ground pool that isn’t fenced, distressed properties, or obvious code violations.28


Realty listing on UtahRealEstate.com, a multiple listing service. The interior photos (this listing has 53) are examples of the types of images CoreLogic has access to as owner of the MLS platform software. From UtahRealEstate.com, 2020.
The company advertises that MLS-provided property photos can be combined with research correlating “more than 100,000 construction line items and 90 labor trades as well as construction crew sizes, productivity, soft costs and code variations,” title transfer, foreclosure information, public tax assessor records, and work permits, all which serve to track when upgrades and restorations are made to specific properties.29 This dizzying amount of information is directed at reducing overall model uncertainty and allowing the company to claim that their estimates of replacement cost are more current and up-to-date than competitors. The purportedly “happier homeowner” is juxtaposed against the interests of insurance companies, who can now more easily reject claims because their customers fail to maintain their property or can be shown to have violated local building codes, whether wittingly or not.
Conclusion
The influence of climate change on natural hazards is introducing new uncertainties into calculating insurance risks.30 Understanding natural hazards, however, is only one component of accurately forecasting catastrophe loss. Social norms such as building codes and other efforts to mitigate risks have a major influence on how a disaster unfolds in time and space.31 Yet the social world is never “finished,” and so it remains hard to model the changes in social structures. One response to the obstacles of accurately simulating future states is to reduce uncertainty in exposure data by exhaustively documenting the existing built environment.
Accumulating data about homes and buildings deepens the predictive variables in risk assessors’ exposure databases. It can reduce the time it takes for an insurer to adjust a claim after a disaster and make the allocation of company resources more efficient during the crucial early part of a recovery.32 It may even strengthen arguments for better building code enforcements and increased public expenditure on risk mitigation. Yet, it also represents a potentially invasive breach of privacy. The imagery from above, the photo from within—the customer has no idea these interventions have taken place. How does a homeowner gain a sense of the role intimate spatial images play in the availability of their insurance? Do premiums only go up, or do corporate savings from increased efficiencies also translate into more affordable insurance? Is fraud detection a secondary, or primary imperative of these new calculative devices? If the algorithm classes a claim as fraudulent, what kind of grief must an individual go through to prove otherwise?
Additionally, while these innovations may be justified to improve portfolio-level loss estimates, what else might they be used for? As Todd Stennett, an executive of Geomni, put it at an trade fair in 2018: “We are looking for folks who are interested in working [this] data into all other end user applications outside of insurance and we’ve got pretty much a whiteboard; we can work with you to write some numbers that would make sense…and help you make more money and help us monetize this content into other vertical markets.”33 In the logic of surveillance capitalism, these companies would be negligent if they did not try and convert comprehensiveness into new and unforeseen revenue streams. Data accumulation becomes its own rationale. But what, or who, governs the collection, sharing and use of this data?34
Catastrophe models are important tools that have helped stabilize insurance markets in the face of changing natural disasters. The main purpose of the models, as one of the head engineers at the modeling firm AIR puts it, “is not to predict losses at a location for a given event, but to provide reliable estimates of potential losses to portfolios of properties…and to effectively differentiate the vulnerability of properties in different regions.”35 By increasing the resolution on individually coded, periodically updated identifiers for each property in an insurer’s portfolio, cat modelers are expanding techniques of differentiation, while also heightening lived experiences of difference. Whether comprehensiveness, however, can enhance resilience to disasters without also introducing new algorithmically encoded social disparities is an open question that deserves ongoing scrutiny.
Simply put, uninsurable projects go unbuilt. Banks will neither finance a mortgage nor lend money to an industrial facility if the prospective homeowner or business cannot secure insurance. On the flip side, insurers also encourage risk mitigation, something seen in the industry’s role in the development of early building codes as a means for managing urban fire risks. Sprinkler systems, fire escapes, and inflammable building materials all grew from investments by insurers. These twin logics of loss speculation and loss prevention are integral to the sector’s model of capital accumulation.
Event attribution, a field of science that detects the influence of climate change on extreme weather, gets directly at this problem. Using counterfactual modeling techniques, scientists compare the likelihood that actual events would achieve their recorded intensities in both a climate-altered and non-climate altered world. This allows them to calculate the “fingerprint” of climate change on already transpired events. The American Meteorological Society has been publishing an annual series of studies in this rapidly maturing field since 2011. See “Explaining Extreme Events from a Climate Perspective,” American Meteorological Society, ➝.
On “non-calculability” see, for example, Ulrich Beck, Risk Society (New York: Sage Publications, 1992).
This database, called HURDAT, is maintained by the US National Oceanic and Atmospheric Administration (NOAA). Since 1900, there has been less than two landfalling hurricane per year on average in the continental United States—not really a time series that lends itself to robust statistical analysis. This absence of loss data is what the models solve.
Damian Carrington, “Climate Change Threatens Ability of Insurers to Manage Risk,” The Guardian, December 7, 2016. A growing body of science attributes worsening storms to the warming of the climate (cf. Adam H. Sobel et al., “Human Influence on Tropical Cyclone Intensity,” Science 353, no. 6296 (2016): 242–46), and the trend is expected to become more severe as anthropogenic change accelerates (cf. Hiroyuki Murakami et al., “Dominant Effect of Relative Tropical Atlantic Warming on Major Hurricane Occurrence,” Science 362, no. 6416 (2018): 794–799).
Paige St. John, “Creating an $82 billion threat: the formula—a hotel room, four hours and a dubious hurricane computer model,” Sarasota Herald-Tribune, November 14, 2010.
Cf. Marion Fourcade and Kieran Healy, “Classification Situations: Life-Chances in the Neoliberal Era,” Accounting, Organizations and Society 38, no. 8 (November 2013): 559–72; Eric Siegel, Predictive Analytics: The Power to Predict Who Will Click, Buy, Lie, or Die (Hoboken: Wiley, 2016); Zeynep Tufekci, “Algorithmic Harms Beyond Facebook and Google: Emergent Challenges of Computational Agency,” Colorado Technology Law Journal 13 (2015): 203.
Shoshana Zuboff, The Age of Surveillance Capitalism: The Fight for a Human Future at the New Frontier of Power (New York: Public Affairs, 2019). According to Zubhoff’s critique, surveillance capital, as epitomized by companies such as Google or Facebook, is premised on the exploitation of surplus personal data which the companies collect by monitoring user behavior on their services. This surplus data (frequently called “data exhaust” in the industry), whose existence remains both unknown and completely invisible to the user, can be packaged and sold to other parties, thus creating new value streams for the surveillance capitalist.
There have traditionally been three major cat modeling firms globally: Risk Management Solutions (RMS), Applied Insurance Research (AIR) and EQECat (now called CoreLogic). RMS and AIR currently dominate the field, although a host of new weather and climate risk analytics firms such as Jupiter Intelligence, One Concern, and Four Twenty Seven are increasingly competing in this space. See also: Don G. Friedman, “Natural Hazard Risk Assessment for an Insurance Program,” The Geneva Papers on Risk and Insurance 9, no. 30 (1984): 57–128.
Patricia Grossi and Howard Kunreuther, Catastrophe Modeling: A New Approach to Managing Risk, Springer Science & Business Media, 2005.
Friedman, 1984, 55.
Barry Gilway, “Citizens Property Insurance Corporation,” CEO of Citizens Property presentation to the US Department of Treasury Advisory Committee on Risk-Sharing Mechanisms (ACRSM), July 28, 2017, ➝.
See Karen Clark, “Big Data Analytics: Mining Your Catastrophe Claims Data for Competitive Advantage,” Carrier Management, July 20, 2016. This is not “big data” on the order of daily tweets or Facebook hits, but big in terms of the amount of information encoded with each claim. In 2017, for the entire US, according to the National Bureau for Economic Research, there were over five million individual catastrophe claims with private insurers (catastrophes being events defined as causing over $25 million in losses for the insurance sector). See also: “Facts + Statistics: U.S. Catastrophes | III,” Insurance Information Institute, 2018, ➝.
Not only do rules for building design change, but so do institutional responses to natural disasters. When estimating the post-disaster replacement cost value of a home, modelers now anticipate non-linear social factors such as community investment in disaster preparedness (i.e. pump stations; rapid response teams), demand surge on construction materials, tightening labor markets under times of crisis, and even looting, among other factors. They build these factors into their risk assessments (thereby adding justifications for higher premium rates to meet these modeled contingencies).
The BCEGS sends teams to communities to assess numerous factors of “enforcement,” including how many people a city’s inspection department employs, whether the city planning office has specific rules governing constructing for natural hazards, who licenses building contractors within a community’s jurisdiction, etc.
See: Martha Lampland, “False Numbers as Formalizing Practices,” Social Studies of Science 40, no. 3 (2010): 377–404; Paige St. John, “Hurricane models: garbage in, gospel out: In secret calculations, a stew of flawed data,” Sarasota Herald-Tribune, November 15, 2010.
Cf. Big Data for Insurance Companies, eds. Marine Corlosquet-Habart and Jacques Janssen (Hoboken: Wiley-ISTE, 2018); Tony Boobier, Analytics for Insurance: The Real Business of Big Data (Hoboken: Wiley, 2016).
Cf. Evan Mills, “The Greening of Insurance,” Science 338, no. 6113 (2012): 1424–25; Dimitrios Tselentis, George Yannis, and Eleni Vlahogianni, “Innovative Insurance Schemes: Pay As/How You Drive,” Transportation Research Procedia 14 (2016): 362–71.
Cf. Lacie Glover, “3 Ways Car Insurers Use Technology to Monitor Driving and Offer Discounts,” Chicago Tribune, July 31, 2018; Dimitris Karapiperis et al., Usage-Based Insurance and Vehicle Telematics: Insurance Market and Regulatory Implications (Washington, D.C.: National Association of Insurance Commissioners, 2015), ➝.
See: Suzanne Barlyn, “Strap on the Fitbit: John Hancock to Sell Only Interactive Life…” Reuters, September 19, 2018; Bernard Marr, “How Big Data Is Changing Insurance Forever,” Forbes, December 16, 2015.
“CoreLogic: Taking Big Data Analytics to New Customers and Consumers,” Insurance Journal, December 2, 2014.
Large private property owners will hire building inspectors to gather secondary characteristics in order to reduce their insurance premiums. In a big portfolio of properties, perhaps only a handful of buildings will account for a large percentage the modeled risk estimates, and a company seeking insurance can sometimes drive down the price of their insurance by gathering more bespoke data showing that the one or two large buildings (say warehouses with inventory, or crucial manufacturing structures) that account for most of their loss estimates are less risky than suggested by the models.
Joseph Emison and Holly Tachovsky, “A National Loss Study: The Billion Dollar Impact of Underestimated Roof Age,” Claims Journal, October 3, 2014. This estimate does not account for lack of knowledge about roof structures and building materials.
While the market in the US is further advanced than anywhere else, Verisk recently acquired UK-based aerial imagery company Geoinformation Group in 2016 to build up equivalent property imagery capacity in Europe.
Author interview with senior cat modeling executive, June 29, 2018.
As one modeling executive told me, “Because it’s a lot of investment on an insurance company’s part to collect this (secondary) information. Do you just believe the homeowner when he gives you this information? Because he might lie to get his premium reduced, so you might have to send out someone to inspect it right? But this is money.” Interview, December 14, 2018.
“About Geomni,” Geomni, ➝.
“Property Imagery for Insurance—CoreLogic,” CoreLogic, ➝.
Ibid.
Bradley Hope and Nicole Friedman, “A Hotter Planet Reprices Risk Around the World,” Wall Street Journal, October 3, 2018.
A wealth of social science research makes this point. Cf. Kai Erickson, Everything in its Path: Destruction of Community in the Buffalo Creek Flood (New York: Simon and Schuster, 1978); Eric Klinenberg, Heat Wave: A Social Autopsy of Disaster in Chicago (Chicago: University of Chicago Press, 2015).
Denny Jacob, “Managing claims in a changing climate”, Property and Casualty 360, National Underwriters, January 7, 2020.
See interview with Todd Stennett at the 2018 SPAR3D Expo and Conference in Anaheim, CA. Point of Beginning (POB), “Get to Know Geomni,” YouTube, September 7, 2018.
The crucial questions Shoshana Zuboff says should be asked of companies that surreptitiously collect and exploit user data for profit are: “Who decides how the data is used? And who decides who gets to decide how it is used?” Zuboff, The Age of Surveillance Capitalism, see particularly Chapter 6: Hijacked: The Division of Learning in Society, 176–198.
Karthik Ramanathan, “Modeling Fundamentals—Anatomy of a Damage Function,” AIR Currents, 2017, ➝.
Accumulation is a project by e-flux Architecture and Daniel A. Barber produced in cooperation with the University of Technology Sydney (2023); the PhD Program in Architecture at the University of Pennsylvania Weitzman School of Design (2020); the Princeton School of Architecture (2018); and the Princeton Environmental Institute at Princeton University, the Speculative Life Lab at the Milieux Institute, Concordia University Montréal (2017).


.png,1600)